Solar radiation study data gauge photovoltaic power-generation potential
Generating electric power from the sun has attracted petroleum industry investment in recent years, most notably from Royal Dutch/Shell Group and BP PLC.1
Both companies are committed to expanding investment in solar technology in response to the 1997 Kyoto Protocol to cut emissions of carbon dioxide and other greenhouse gases.
Government and industry alike regard solar as an emerging technology for generating electric power without generating CO2 emissions.
This article summarizes the results of the author's study of the potential for generating electricity from the sun with photovoltaic (PV) collectors. Solar radiation data for selected locations in the US are arranged graphically to illustrate how solar radiation varies by hour, month, climate, and orientation of the solar collectors.
Hypothetical applications also illustrate how much electricity they can generate, and how much collector area is required for a desired electrical output. The geographic placement of any PV system is critical because insolation (solar radiation) is greatly affected by cloud cover and latitude.
Improvements in PV technology have reduced costs by about 5%/year for the past 20 years. In response, subsidies have become available in Japan, Germany, Switzerland, the Netherlands, and the US for power users to install PV systems (OGJ, July 10, 2000, p. 80).
PV systems typically convert into electricity about 10% of the solar radiation striking a collector. The principal variables affecting the intensity of insolation are cloud cover, elevation of the sun above the horizon, and the angle of the radiated surface to the sun.
Power users who reduce their draw from the power grid with PV systems typically have two-way meters. When the PV system generates more power than is consumed, the excess flows into the power grid and is credited to the user.
Solar radiation data
Solar radiation data in this study comes from the National Renewable Energy Laboratory (NREL) database.2 Insolation is listed in units of kw-hr/sq m/day for 239 locations throughout the US.
Solar intensities, measured at each location during 1961-90, are presented as annual and monthly averages. Solar radiation is also presented in an hourly format.
Separate datasets are presented for 10 orientations of flat-plate collectors, either in fixed positions or as tracking the sun.
There are five orientations in fixed positions:
- Horizontal, which is equivalent to solar radiation striking the earth's surface.
- Facing south, tilted at an angle equal to the latitude of the site, less l5°. By salvaging more sunlight in the winter, this orientation is exposed to more insolation on an annual basis than the horizontal position.
- Facing south, with the tilt equal to site latitude. Of all the fixed positions, this orientation receives the most insolation annually, generally about 2% more than the tilt equal to the latitude minus l5°.
- Facing south, with the tilt equal to the latitude +15°. This orientation receives still more insolation in the winter, but sacrifices exposure in the summer. Annual exposure is 4-5% lower than the tilt equal to the latitude.
- Facing south, with the tilt equal to 90°. Vertical orientation receives the least amount of annual insolation by sacrificing the most insolation in the summer. It simulates PV collectors incorporated into windows or exterior walls of buildings.
NREL also presents data for one-axis tracking systems of flat-plate collectors. The axis is oriented north and south with separate datasets for the axis tilted at 0°, latitude -15°, latitude, and latitude +15°. One-axis tracking improves annual exposure by 25-35%, vs. corresponding fixed orientations, depending on location.
This article also presents data for a two-axis tracking system that maximizes exposure of flat plates to insolation. Such a system tracks the sun in both azimuth and elevation, thus keeping the collectors normal to the sun's rays. Two-axis tracking collects 3-5% more insolation than the best one-axis tracker with its axis tilt equal to the latitude.
In addition, this article presents data for four orientations of parabolic-trough concentrating collectors. Concentrating collector systems collect about 20% less sunlight per unit area than equivalent flat-plate tracking systems. To limit the scope of this article, it covers only flat-plate collectors.
Panel wattage ratings
The rated wattage output for a PV panel is measured by exposing a panel to 1,000 w/sq m of insolation. A panel of 1 sq m may thus be rated at 100 w.
Such ratings are highly misleading because insolation rarely reaches 1,000 w/sq m, i.e., only midday in midsummer or late spring, under cloudless skies. A panel rated at 100 w, then, might deliver only 20 w on a cloudy day. The output of a PV system could vary by a factor of five, depending on cloud cover.
Hourly insolation data
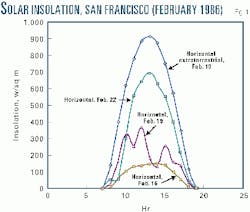
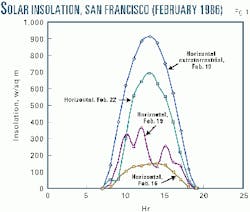
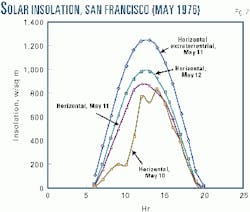
Figs. 1 and 2 illustrate the range over which insolation can vary. Hourly insolation data on a horizontal surface was selected for San Francisco on days when weather conditions varied significantly.3
Fig. 1 shows hourly insolation for 3 days in February 1986, when weather varied from complete cloud cover to nearly cloudless. The transition day featured a sunny morning with midday clouds.
The fourth profile-horizontal, extraterrestrial-is insolation on a horizontal panel located atop the earth's atmosphere. It illustrates how much energy the atmosphere and clouds absorb. The shape of the insolation profile for each day indicates the degree of cloudiness.
Electricity generated by PV would have varied considerably during those days. Feb. 16 would have generated 25.3% of the power generated on Feb. 22. Power generated on Feb. 19 would have been 49.4% as much.
The 3 days for May 1976 (Fig. 2) show insolation during an approaching heat wave under cloudless skies. The morning of May 10 was overcast, with the 10 a.m. hour recording only 25% of the insolation as the same hour on May 12. The matching shapes of the profiles for May 12 and extraterrestrial indicate that the sky was perfectly clear all day on May 12, giving maximum insolation. A PV panel would have generated its rated wattage for 2 hr on May 12, but at no other time.
A home PV system with 10 sq m of horizontal panels would have generated 8.17 kw-hr on May 12, perhaps 80% of the family's electrical needs. By contrast, the system would have generated only 1.05 kw-hr on Feb. 16, 1986.
Fixed, flat-plate collectors
Insolation data shown in the remainder of this study are 30-year averages for each month in units of kw-hr/sq m/day.
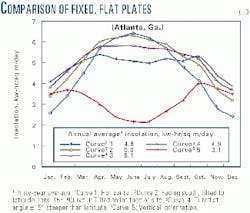
Fig. 3 shows insolation in Atlanta for each of the five orientations of fixed, flat plates. Curve 1-horizontal-has the widest annual range, with 2.67 times more exposure in June than in December.
Insolation for horizontal plates is proportional to the sine of the solar angle. If cloudiness does not vary significantly from month to month, the annual insolation profile will resemble a sine curve. Such is apparently the case in Atlanta, for Curve 1 closely replicates a sine curve. The slight bump in October indicates clearer skies than for other months.
Tilting the panels upward from horizontal improves annual exposure to insolation by raising the sag of the winter profile, yet tempering the summer peak. The optimum angle of tilt is equal to the latitude of the site (Curve 3). Tilt angles steeper than latitude further depress the summer peak with only a marginal increase in winter (Curve 4).
Vertical orientation (Curve 5) has the lowest insolation in the summer because of steep sun angles; it approximates the mirror image of horizontal orientation.
A panel of 1 sq m tilted toward the sun at latitude, then, would receive 5.7-5.8 kw-hr of insolation, on average, each day during April-August. Using the 10% factor for conversion to electricity, the panel would generate about 24 w (580 w-hr/24 hr). Most of the 580 w-hr thus generated during an average summer day comes during the 4-5 hr when the sun is highest in the sky. An hourly insolation profile for Atlanta during a typical summer day, punctuated with clouds, would be similar to that for San Francisco on May 10, 1976 (Fig. 2).
A 1 sq-m panel on the side of a building in Atlanta would generate less than 10 w during May-July, peaking around 17 w in October.
Flat-plate tracking
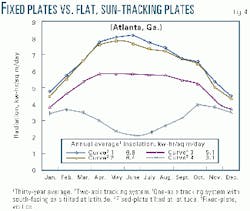
Fig. 4 compares insolation upon fixed plates with flat plates that track the sun. Curve 1 is insolation on a two-axis tracking system for maximum possible exposure. Curve 2 is insolation for one-axis tracking, with the south-facing axis tilted at latitude. Curve 3-in Figs. 3 and 4-is insolation for fixed plates tilted at latitude.
One-axis tracking receives about 25% more annual insolation than fixed plates; two-axis tracking receives about 29% more. Electrical generation for one-axis tracking would be about 32 w/sq m during April-June and about 34 w/sq m during May-June for two-axis tracking.
Prospective PV system owners should compare the added cost of a tracking system with the savings from additional power generated.
Variations from cloudiness
The next part of the study gauged the effect of cloudiness and latitude on PV electrical generation. The following analyses compare insolation for fixed-plate collectors tilted at latitude (optimum tilt angle) for a wide variety of locations around the US.
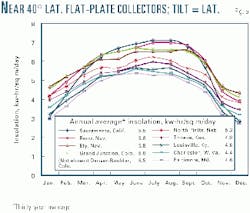
To gauge the effect of cloudiness, insolation profiles are shown in Fig. 5 for nine cities at the same latitude. Sacramento, Calif.; Reno and Ely, Nev; Grand Junction, Colo.; North Platte, Neb; Topeka, Kan.; Louisville, Ky.; Charleston, W.Va.; and Baltimore are approximately aligned along the 40th parallel. The only variable to insolation is cloudiness.
The highest insolation is observed across an expanse spanning the Great Basin to the Rocky Mountains. From Reno to Grand Junction, annual average insolation is 5.8 kw-hr/sq m/day. Farther east, insolation begins to decline: the Denver-Boulder, Colo. area is 5.5 (not shown) and North Platte, Neb., 5.3.
Sacramento experiences the widest range of insolation along the 40th parallel. Its rainy, foggy winters keep insolation below 3.0, but cloudless summers give 7.0-7.2 for nearly 4 months. Its annual average is the same as for Denver-Boulder.
Ely and Grand Junction receive the highest winter insolation, 4.1-4.6 kw-hr/sq m/day. Summer thunderstorms keep insolation 6.6-6.8, slightly below that of Sacramento.
East of Colorado, insolation gradually tapers off. Summer peaks do not reach 6.0 kw-hr/sq m/day east of Topeka. From Louisville to Baltimore, clouds and thunderstorms keep summer peaks at 5.4-5.7.
PV systems of fixed plates tilted at latitude, installed east of the Mississippi River, will generate 76-80% of the electricity generated from a same-sized system installed between western Nevada and western Colorado. Charleston would need 32% additional PV surface for the same annual electrical output as a system in Reno or Grand Junction, i.e., a Charleston system would cost 32% more.
Latitude's effect
Cities chosen to gauge the effect of latitude on insolation had similar patterns of cloudiness over a range of latitude. Cloudiness frequently varies with latitude, but some degree of control is possible by selecting cities within similar climate zones, roughly corresponding to a combination of longitude and location relative to mountain ranges.
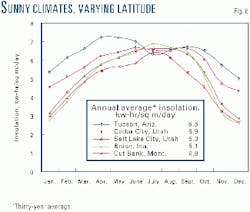
Fig. 6 shows insolation profiles for five cities in sunny climates over a nearly 17° range of latitude: Tucson, Ariz.; Salt Lake City and Cedar City, Utah; Boise, Ida.; and Cut Bank, Mont.
Annual average insolation declines steadily with increasing latitude, with Cut Bank receiving 26% less than Tucson. Some of the difference may be due to variations in cloudiness. For instance, maximum insolation for Tucson occurs during April-May but sags during June-August. Even October insolation exceeds that of July, which illustrates the effect of summer thunderstorms in the southwestern desert region.
By contrast, peak insolation far to the north in Boise comes during July-August, exceeding that in Tucson during both months. In fact, Tucson receives the least insolation in July among the five cities, despite having the highest annual average.
Other spans of latitude
Insolation profiles across other spans of latitude reveal new implications for potential PV electrical generation. In these comparisons, cloudiness also varies with latitude, which changes insolation even further.
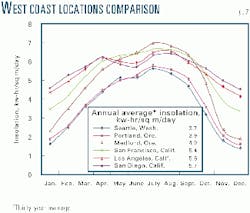
Fig. 7 shows insolation profiles for six far-western cities from San Diego to Seattle, spanning nearly 15° of latitude. The three California cities, all with coastal climates, show rather flat profiles during summer months, tempered by marine overcast. Differences in latitude are evident only from differing profiles during November-March.
Medford, Ore., with an inland climate and relatively cloud-free summers, has higher summer insolation than coastal California. Rainy winters, however, bring down the annual average below that of San Francisco. Portland and Seattle, with persistent clouds throughout most of the year, receive the least insolation of any metropolitan region in the US outside of Alaska.
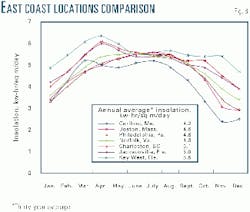
Fig. 8 shows insolation profiles for seven cities along the eastern seaboard across more than 22° of latitude. The striking feature is the remarkable consistency of summer insolation. Throughout Florida to Boston, summer clouds flatten each profile, showing little change with respect to latitude.
Increasing cloudiness from north to south evidently neutralizes the greater solar intensity at lower latitudes. For example, Boston receives the same insolation as Key West, Fla., during June-August. During October-April, however, East Coast profiles separate, indicating that cloudiness is more consistent with latitude than in the summer.
Coastal cities from Boston to Norfolk have nearly identical profiles, indicating consistent cloudiness throughout both the region and the year. This characteristic contrasts with the California coast, where, along an equivalent distance from San Diego to San Francisco, seasonal variations of insolation are greater, and annual averages are 1 kw-hr/sq m/day (about 20% greater) than the East Coast. At a latitude 13° higher, San Francisco has almost the same annual average insolation as Key West.
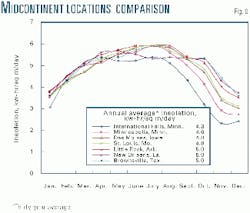
Fig. 9 shows insolation profiles for seven cities through the Midcontinent between the Canadian and Mexican borders, across nearly 23° of latitude. The range of insolation is even narrower than for the East Coast cities. Only International Falls, Minn., "the Icebox of the Nation," separates from the cluster of profiles. Yet, International Falls receives only 14% less insolation annually than Brownsville, Tex. Even Minneapolis receives the same insolation as Brownsville during January-August.
Southwestern desert PV potential
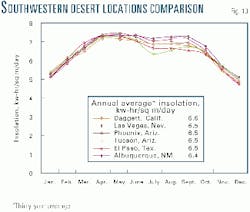
Fig. 10 shows insolation profiles for the six cities with the highest annual insolation. This region receives 30-35% more insolation annually than most other regions in the US. For flat plates tilted at latitude, insolation averages 6.5 kw-hr/sq m/day. Daggett, Calif., in the Mojave Desert, receives the highest annual insolation of the 239 US stations.
Late spring gives the highest insolation. For example, May in Phoenix gives the highest insolation for any month of all the stations. Summer thunderstorms flatten the profiles at times when the Great Basin or portions of the Great Plains receive peak insolation.
While the desert Southwest appears to offer the greatest potential for PV systems, high temperatures adversely affect PV efficiency. The electrical output of PV panels is rated at 25° C. A PV panel at 50° C., however, produces about 90% of the wattage it produces at 25° C.4
Desert locations, with ambient temperatures commonly reaching 40° C., would lose some advantage of high insolation. The irradiative effect of a midday summer sun with little breeze would elevate the temperature of panels to 50° C., thus depressing PV output to that of locations in the Great Plains.
Windows, building facades
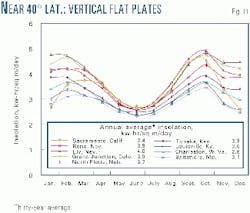
Fig. 11 shows insolation profiles for vertical collectors to simulate PV panels incorporated into windows or exterior building walls. The profiles are for the same cities along the 40th parallel in Fig. 5.
Vertical panels receive the least amount of insolation in the summer, because high sun elevations strike the panels at the smallest angles. For most locations, the best exposure to sunlight is during February and October.
Vertical panels are typically exposed to 62-69% of the annual insolation of panels tilted at latitude. Thus, 45-61% additional surface area would be needed to generate the equivalent amount of electricity. For example, a system in Little Rock would require 20 sq m of panels tilted at latitude to generate 10 kw-hr on an average day throughout the year. A system of vertical panels would require 32.3 sq m to generate 10 kw-hr/day.
PV use positives and negatives
The study resulted in a number of conclusions:
- While PV technology offers a tantalizing supply of pollution-free energy, insolation is so dispersed that great arrays of collectors are required for modest output. Under ideal conditions, with insolation of 1,000 w/sq m (when collectors generate their rated power of 100 w/sq m), it would take 10 million sq m of PV collectors to generate 1,000 Mw, the output of a single large power plant.
- Cloudiness and season are the dominant variables in determining electrical output from insolation upon a given PV system.
- Wattage output from a PV system throughout a typical summer day, for most locations east of the Great Plains, would track a profile similar to that shown in Fig. 2 for San Francisco on May 10, 1976. A collector of 1 sq m (rated at 100 w) would generate 70-80 w for about 4 hr and 20-40 w during cloudy hours.
- Only minor differences in insolation are observed across vast reaches of the US. From Canada to the Gulf of Mexico and from the East Coast to the Great Plains, the annual average insolation is 4.2-5.4 kw-hr/sq m/day for panels tilted at latitude. Most of this territory receives insolation within an even more narrow range, 4.8-5.2 kw-hr/sq m/day.
- At 10% conversion of insolation into electricity, 20 sq m of PV panels would be required to generate 10 kw-hr/day, typical for a small household. For horizontal panels, 23 sq m would give the same output.
- Even in the sunniest climates, large PV arrays would be needed to generate a significant portion of a household's electricity. During May in Phoenix-the time and place of highest insolation in the US-it would require 20 sq m to generate 15 kw-hr/day of electricity. Additional air conditioning in the hot climate would necessitate another 5 kw-hr/day above typical usage.
- Wide variations of latitude east of the Rocky Mountains have little effect on insolation, because cloudiness increases at lower latitudes.
- Latitude influences insolation west of the Rockies, where cloudiness is more consistent with respect to latitude.
- Cloudiness on the West Coast increases at higher latitudes, thus reducing annual average insolation in the Pacific Northwest to below 4.0 kw-hr/sq m/day, for panels tilted to equal site latitude.
- Desert regions of the US offer the greatest potential for PV electrical generation with insolation of 5.8-6.6 kw-hr/sq m/day. However, PV output in summer may be reduced by 10% because high midday temperatures reduce PV efficiency.
The future
During the next 20 years, increasing numbers of businesses and families are likely to see improving economics for installing PV systems. Costs for PV are expected to shrink while costs for conventional power generation increase. With government subsidies, or rebates, for installing PV, more consumers will be encouraged to "go solar."
For example, the Renewable Resources Fund that California administrates has committed $54 million for renewable energy projects such as solar or wind. By installing and connecting a qualified system to the power grid, a consumer can be rebated $3/w-rating, against the installed cost of the system.5
Thus, a PV system rated at 1,000 w can be rebated $3,000, even though it might generate only 200-300 w on cloudy days.
With rebates, a consumer may be able to amortize the remaining installed cost of a PV system in less than 10 years. If enough consumers choose to assume the responsibility of generating much of their own electricity, a new uncertainty will be introduced into the energy mix.
Suppose that PV systems eventually supply 10% of peak-period wattage within a regional power grid (under cloudless skies). On cloudy days, the systems would generate 2-5% of total grid power. The difference would have to be supplied by conventional generation.
Furthermore, the reliability of the 2-10% of grid power PVs supply depends on how well individual owners maintain their systems to keep them operating. That increment of wattage is outside the control of any system authority. If PV owners falter in maintaining their systems after completing the minimum required operating period, spare generating capacity for the grid would shrink, thus increasing the risk of rotating power outages.
References
- International Petroleum Encyclopedia 2000, p. 162, PennWell.
- National Renewable Energy Laboratory (NREL), Golden, Colo. (www.nrel.gov).
- NREL, (http://rredc.nrel.gov/solar/ old_data/nsrdb/hourly/).
- "Temperature Dependence of Photovoltaic Cells, Modules, and Systems," K. Emery et al., NREL.
- California Public Utilities Commission, (www.energy.ca.gov/greengrid).
The author
Thomas H. Standing has worked in civil and chemical engineering disciplines including refinery operations, chemical process design, and most recently, pipeline maintenance for the San Francisco Public Utilities Commission. Concurrently he is analyzing trends in production and development of North American oil resources from publicly available data and assessing the potential energy contributions from renewable and alternative sources. He has a BS in chemical engineering from the Uni versity of Minnesota and is a registered civil engineer in California.
