Equations estimate relative permeability of mixed wettability shaly sands
New equations for estimating the relative permeability curves for both water-oil and gas-oil systems have been developed for shaly sands in mixed wettability formations of the Western Desert in Egypt.
These correlations also may be used in other regions of the world.
The developed equations have good agreement with laboratory data.
Permeability correlations
Relative permeability is a direct measure of a porous medium's ability to conduct one fluid when one or more fluids are present. These flow properties are the composite effect of pore geometry, wettability, fluid saturation, and saturation history.1 2 The direct determination of relative permeability from special core analysis data and theoretical considerations is valuable information for reservoir analysis.
Laboratory methods for measuring the relative permeability curves include steady state and unsteady-state methods.3 4 These methods are expensive and time consuming. With these methods, the relative permeability curves of representative and sufficient core samples from a reservoir are measured and then the curves are averaged to obtain an average relative-permeability curve for that reservoir.
In the case in which the number of the available core samples is insufficient, the Khairy technique can be used to generate two-phase relative permeability curves.5 In the absence of core analysis data, the relative permeability can be determined from empirical equations. In the case of three-phase flow, three-phase relative permeability models such as those of Naar,6 Blunt,7 and Moulu8 can describe the flow in the reservoir.
For two-phase flow, two-phase relative permeability correlations, such as those of Wyllie,9 Naar,10 Pirson,11 Honarpour,12 and Mohamed,13 predict flow in a porous media.
Some of these correlations have disadvantages. For instance, the Naar correlation does not specify the rock type and the Honarpour correlation does not distinguish between intermediate and mixed wettability. Some of the other correlations also do not specify wettability conditions.
Additionally from the Mohamed correlation, the development of the two-phase relative permeability curves from normalized relative permeability vs. normalized saturation is impossible without knowing the end points of the relative permeability curves and the absolute reservoir permeability.
Petroleum engineers are liable to use these models indiscriminately for predicting reservoir performance. One study compared the relative permeabilities estimated by ten different two-phase relative permeability models with 12 experimental data sets gathered from Berea and Brown sandstone.14
This study also used a two-dimensional, two-phase numerical simulator to compare the performance of four of the experimental relative permeability data sets and those predicted by the models used to predict Buckley-Levert displacement and waterflooding performance.
The study indicated a varying degree of performance for the correlations in reservoir engineering calculations. This may have been due to each correlation having its own applicable conditions, such as lithology, wettability, rock properties, and fluid saturations ranges.
The study showed that the Wyllie, Naar, Pirson, and Honarpour correlations have a low accuracy when applied to shaly sand formations of mixed wettability.
Data description
The data used as a basis for this study to derive new correlations were derived from core samples in the Western Desert in Egypt.5 15 16 The data sets are for consolidated shaly-sandstone of mixed wettability. The wettability classification is based on Amott and Amott-Harvey wettability indices, oil-recovery efficiency of water displacement and characteristics of relative permeability, and capillary pressure curves.5 15 16
The study included 57 core samples from 13 different formations. All the laboratory tests were made at room temperature and atmospheric pressure.
Equations of the oil-water system refer to displacement of oil by water, and the gas-oil system equations refer to displacement of oil by gas. The base permeability of the measured relative permeability values is the effective oil permeability at irreducible water saturation, Swi. The data were normalized by use of published methods.5 17
A comparison of the analyzed curve shape with the usual shape of the relative permeability curves checked the validity of the relative permeability analysis. This led to the exclusion of three core samples for the water-oil system and eight core samples the for gas-oil system.
The new equations for water-oil system were based on 54 core samples and 627 data points, while the equations for gas-oil system were based on 49 core samples and 641 data points.
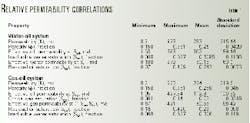
Tables 1 lists the range of the data used to develop the equations.
Equations
Equations 1-13 (see equation box) were derived by using linear regression analysis techniques to develop equations that would approximate the normalized data, (Kro*)o-w and (Krw*)o-w vs. Sw*, and (Kro*)o-g and (Krg*)o-g vs. Sg*.
During the preliminary evaluation stage, one can estimate the critical gas saturation with Equation 13, and the critical gas saturation can be refined by history-matching production data.
The R2 statistical concept determined the goodness of fit of the new equations. As R2 approaches 1, it indicates an adequate fit.
Estimation of curves
Estimating the relative permeability curves for water-oil and gas-oil systems using the new equations requires the following steps:
- Determine the effective oil permeability (Ko)o-w at Swi from transient well test.
- Use the value of (Ko)o-w at Swi in Equations 10-13, estimate values to (Krw)o-w at Sor, (Krg)o-g at (1-Swi-Sor), (Kro)o-g at Sgc, and Sgc.
- Estimate values to Swi, and Sor from well log data.
- Use the estimated values in Steps 2 and 3 in Equations 5-8 to estimate the relative permeability curves for oil-water and gas-oil systems.
Results
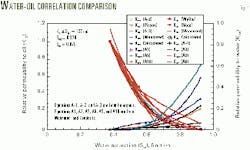
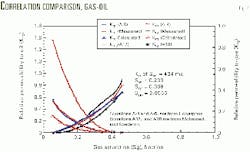
The results from these equations were compared to the results from correlations of Wyllie, Naar, Pirson, Honarpour, and Mohamed, as well as experimental data (Fig. 1).
The end points of the experimentally determined relative-permeability curves and the absolute permeability of the core were used to calculate Mohamed's normalized relative permeability curves and covert them to denormalized relative permeability curves.
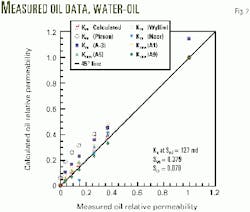
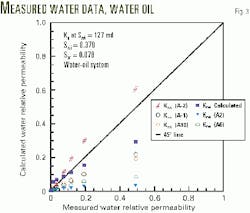
For water-oil systems, Figs. 2 and 3 show estimated oil and water relative permeability vs. measured oil-water relative permeability, respectively. From these figures, one can see the that oil relative permeability lies between that of Equation A9, which is for intermediate, mixed wetting conditions, and Equations A1 and A5, which are for strong water wet and water wet, respectively.
The figures also show that the new equations for relative permeability are the closest to experimental data. The correlations of Wyllie , Naar, Pirson, and Honarpour have a low accuracy probably because of wetting and lithological conditions.
Figs. 1 and 3 show that the new equation for water relative permeability lies between Equation A2, which is for oil and intermediate wetting conditions, and Equations A2, A6, A1, and A10, which are for strong water wet, water wet, water wet, and intermediate, mixed wettability, respectively.
The new equation for water relative permeability is the closest to the experimental data except at a high water saturation. Fig. 4 shows oil and gas relative permeability curves generated by the new equations, published correlations, and the experimental data from one core sample.
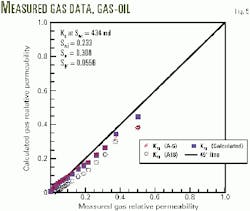
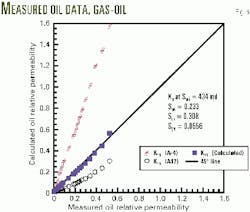
Figs. 5 and 6 illustrate the estimated gas and oil relative permeability vs. measured gas and oil relative permeability, respectively.
Figs. 4 and 5 indicate that the new equation for relative permeability gives higher values than Equation A18, which is for unknown wetting conditions. Also, the equation, except at high gas saturation, has the same order of magnitude as Equation A5, which is for any wetting condition.
The new equation for gas relative permeability is the closest to the experimental data along the entire gas saturation range, and the new equation for oil relative permeability is almost equal to the experimental data along the entire gas saturation range (Figs. 4 and 6).
The figures illustrate also that the new correlation for oil relative permeability lies between Equation A17, which is for unknown wetting conditions, and Equation A4, which is for any wetting conditions.
References
- Craig, F.F., The Reservoir Engineering Aspects of Waterflooding, SPE Monograph Series, 1973.
- Unalmiser, S., and Funk, J.J., "Engineering Core Analysis," JPT, April 1998.
- Amyx, J.W., Bass, D.M., and Whiting, R.L., Petroleum Reservoir Engineering, McGraw-Hill, New York, 1960.
- Honarpour, M., Koederitz, L.F., and Herbert, A.H., Relative Permeability of Petroleum Reservoirs, CRC Press Inc. Boca Raton, Fla., 1986.
- Khairy, M., "Estimating Two-Phase Relative Permeability Using Well Test and Log Data," Journal of Engineering and Applied Science, Vol. 47, No. 4, August 2000, pp. 739-53.
- Naar, J., and Wygal, R.J., "Three-Phase Imbibition Relative Permeability," SPE Journal, December 1961, pp. 254-58.
- Blunt, J.M., "An Empirical Model for Three-Phase Relative Permeability," Paper No. SPE 56474, SPE Annual Technical Conference and Exhibition, Houston, Oct. 3-6, 1999.
- Moulu, J.C., et al., "A New Three-Phase Relative Permeability Model for Various Wettability Conditions," Paper No. SPE 56477, SPE Annual Technical Conference and Exhibition, Houston, Oct. 3-6, 1999.
- Wyllie, M.R.J., "Interrelationship Between Wetting and Nonwetting Phase Relative Permeability," Transactions, AIME, Vol. 192, 1950, pp. 381-82.
- Naar, J. and Henderson, J.H., "An Imbibition Model-Its Application to Flow Behavior and the Prediction of Oil Recovery," SPE Journal, June 1961, pp. 61-70.
- Pirson, S.J., Oil Reservoir Engineering," McGraw-Hill, New York, 1958.
- Honarpour, M., Koederitz, L.F., and Herbert, A.H., "Empirical Equations for Estimating Two-Phase Relative Permeability in Consolidated Rock," JPT, December 1982, pp. 2905-08.
- Mohamed, I.M.N., and Koederitz, L.F., "Two-Phase Relative Permeability Prediction Using a Linear Regression Model," Paper No. SPE 65631, SPE Eastern Regional Meeting, Morgantown, W.Va, Oct. 17-19, 2000.
- Siddiqui, M., Ertekin, T., and Hicks, P.J. Jr., "A Comparative Analysis of the Performance of Two-Phase Relative Permeability Models in Reservoir Engineering Calculations," Paper No. SPE 26911, Eastern Regional Conference and Exhibition, Pittsburgh, Pa., Nov. 2-4, 1993.
- Khairy, M., "An Integrated Approach for Deciding Wettability of Shaly-Sand Reservoirs," Al-Azhar Engineering Sixth International Conference, Cairo, Sept. 1-4, 2000.
- Khairy, M., "Technique determines average capillary pressure," OGJ, Jan. 15, 2001, pp. 37-43.
- Chierici, G.L., "On the Normalization of Relative Permeability Curves," SPE Paper No.5962, 1976.
The author
Mohamed Khairy is an associate professor at King Saud University, Riyadh. He previously was an associate professor at Cairo University and also worked for Agiba Petroleum Co. Khairy has a BS and MS in petroleum engineering from Cairo University and a PhD through a program between Cairo University and Haute Alsace University in France.
