Neural network determines shaly-sand hydrocarbon saturation
Neuro-estimation of water saturation in shaly formation from well log data is powerful and adds a new predicted model for evaluating these formations.
Shaly formation interpretation has been a major problem for log analysts because existing models that estimate hydrocarbon saturation in these formations have wide discrepancies.
Shaly sand models based on shale volume fraction (Vsh) fail consistently to predict representative values of hydrocarbon saturation from wireline data.
Cation exchange capacity models require laboratory-determined concentration of sodium exchange cation associated with clay (Qv) value that is not commonly available to the log analyst. In addition, different laboratory techniques are found to yield different Qv values for the same core sample.
The Louisiana State University (LSU) model has complex calculations and depends on a complicated technique to determine Qv. Also, theoretical model's, such as Berg's model, use a repeated complicated iteration technique.
Therefore, a new shaly model, named artificial neural network (ANN) model, was built. This non-linear model predicts water saturation as a function of conventional well logs. The neural network was trained and tested over a wide range of the Bahariya formation, which is characterized by high clay content.
The model provides an excellent correlation between the inputs and outputs. The accuracy of results derived from the ANN model exceeds that of the previously published shaly sand models.
In general, the ANN model displayed a correlation coefficient of 0.9968 where 1.0 is a perfect match. Moreover, maximum absolute error of less than 2% was observed.
Low resistivity
For many years, low-resistivity formations did not interest well logging research that hinged on the principle that hydrocarbon-filled rocks have a higher resistivity than water-filled rocks. Today, it is believed that many low resistivity formations can produce water-free oil.1 2
The reasons3 for this belief are twofold:
- Calculated water saturation in low resistivity formation is greater than true water saturation because of the presence of clay or conductive minerals such as pyrite.
- Water saturation may be high, but water-free hydrocarbon can be produced because of small pores or large surface areas associated with fine grains and shales in which large amounts of connate water are bound, allowing oil to move easily.
Many researchers, therefore, have studied shaly formations and produced models to estimate water saturation in shaly formation, but each model has its limitations.The ANN approach, discussed in this article, builds a non-linear empirical model to predict water saturation in the Bahariya formation as a function of well logs.
Shaly models
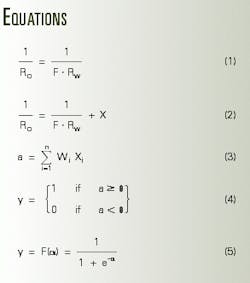
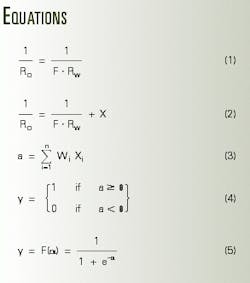
Shaly models are classified into empirical and theoretical models.1 2 The empirical models were developed by modifying Archie's equation due to the presence of shale. Archie's equation, depends on the assumptions that the rock matrix is nonconductive and the only conductive phase is the interstitial water (Equation 1, see equation box).
In Equation 1, Ro is rock resistivity saturated with water (ohms-m), F is dimensionless formation resistivity factor, and Rw is water resistivity (ohms-m).
Because shaly formations contain clay minerals that are conductive, the rock matrix becomes conductive, which contradicts Archie's equation. Equation 2 modifies Archie's equation due to the presence of shale. In Equation 2, X is the excess conductivity due to shale.
The empirical models are further subdivided into three groups according to the dependency of the term X on the water conductivity, Cw, as shown in Fig. 1.3 The theoretical models are based on the Hanai-Bruggeman theory for measuring conductivity of two phases: a continuous phase and a dispersed phase.4
Hamada shows the mathematical formulas for the empirical and theoretical models.3
The first group of empirical shaly models includes Hossin,5 Simandoux,6 total shale (Shlumberger Ltd.),7 modified total shale (Hamada),3 Alfosail and Alkaabi,8 and Archie.1
These models when applied to the Bahariya formation showed high water saturation with respect to the other models.
The second group of empirical shaly models, such as Waxman & Smits,9 and dual-water model (Clavier),10 couldn't be applied because these models need a correlation between the cation exchange capacity (CEC), or the concentration of sodium exchange cation (Qv) and the gamma ray log. Also the LSU model (Bassiouni)11 could not be applied due to its complexity.12
The Archie, Hossin, and Patchett & Rausch models produce large absolute errors. The Alfosail & Alkaabi model showed a good match at lower water saturations and the Simandoux and modified shaly models obtained good matches at higher water saturations.13 Also, the models in the second and third groups reflect a good match at higher water saturation values.
Because these shaly models have some limitations, they often lead to overestimated or underestimated the water saturation. Also, the Berg and modified Berg models have some limitations because the cementation exponent, m, is assumed to be constant.
This is not correct because there is a some variation in the cementation exponent due to increased overburden pressure.13 Moreover, this technique is based on the calculated value of Vsh from the Larinov model that has some errors and limitations.14
Artificial neural networks
Artificial neural networks resurfaced in the mid 1980s after neuro-science made some major advances. Known as sixth-generation computing, neural networks are widely used in many disciplines.
Neural networks are nonalgorithmic, analog, distributive, and massively parallel information-processing methods that have proven to be powerful pattern-recognition tools. Because they process data and learn in a parallel and distributive fashion, they can discover highly complex relationships between several variables that are presented to the network.
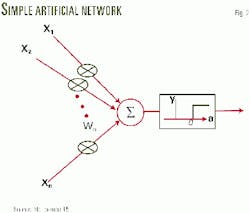
Fig. 2 shows a simple artificial neuron. Suppose there are n inputs with signals x1 , x2, .........,xn and weights w1, w2 ...., wn , the activation a (the output of the sum point) is given by Equation 3, while the neuron output y is given by the threshold of the activation a (Equation 4).
The threshold u often is zero. The threshold function is called a hard-limiter or step function. The use of a step function limits the output signal to a binary term. This may be overcome by softening the step function to a continuos function such as log sigmoid function (Fig. 3 and Equation 5), which was used for the ANN model.
Several paradigms can be used to generate neural networks. In this study, a feed-forward back propagation multilayered neural network, which adopts a supervised training scheme, has been used. The typical multilayers neural network has an input layer, an output layer, and at least one hidden layer (Fig. 4). Each layer is fully connected to the succeeding layer with corresponding weights.15 16
Learning process
Once a network has been structured for a particular application, it is ready to train. To start this process, one randomly selects the initial weights; then the training or learning begins. All learning methods used for adaptive neural network are classified into two categories:15 16
- Supervised learning, which incorporates an external teacher, so that each output unit is told what its desired response to input signals ought to be. An important issue concerning supervised learning is the problem of error convergence, i.e., the minimization of error between the desired and computed unit values. The aim is to determine a set of weights that minimize the error. The least mean square (LMS) is a well-known method that is common to many learning paradigms.
- Unsupervised learning, which uses no external teacher and is based on only local information. It is also referred to as self-organization, in the sense that it self-organizes data presented to the network and detects their emergent collective properties. This method is still at a research stage.
ANN model
As mentioned before, the ANN model uses a feed-forward back propagation multilayered neural network that adopts a supervised training scheme. The model was programmed with MATLAB 5.3 software.
The model included core and log data from five different wells from the Western desert of Egypt: W2 , W4 , W5 , W9 , and W10 . All wells intersect the Bahariya formation.
The Bahariya formation was divided stratigraphically into nine zones: B-I to B-IX. The five upper zones contain almost all the hydrocarbons in the Meleiha fields.
B-I is made up of thinly interbedded, very fine to fine-grained sandstone, variably sandy and silty shales, and thin, laterally extensive limestone. It is characterized by the presence of reservoir layers containing hydrocarbons, but not as much as in B-III, B-IV, and B-V.
B-II consists mostly of interbedded limestone and shales, and it does not contain hydrocarbons except in some marginal cases.
B-III to B-V consist of clean sandstone and shales with thin arealy extensive limestone. These three zones contain the most hydrocarbons.
For supervised training of the feed-forward back propagation network, the model used log and core data, in this case, hundreds of example combinations representing all the Bahariya subdivisions.
The neural network has five input nodes representing deep resistivity, spontaneous potential, gamma ray, litho-density, and neutron porosity log values. The output layer has one node representing the water saturation obtained from special core analysis.
The neural net worked best by using two hidden layers with each consisting of 22 nodes and a log sigmoid transfer function along the entire network.
During the supervised training, it was necessary to provide the network with the correct water saturation value for each example. The network will converge to the correct water saturation value by back propagating the error between its predicted and actual value.
The network was tested against known examples after the network reached a stable state (converged) and learned from all of the data provided.
Results
After the neural network was trained, it was tested to display its ability to estimate or predict water saturation from the five wells in the Bahariya formation (shaly sand). Fourteen examples of log data (that were separated at the beginning of this work for testing the network) were introduced to the network.
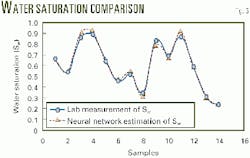
The corresponding water saturations, representing a wide range of from 20 to 92%, were kept as comparisons with the neural network output. Fig. 5 shows the actual 14 water saturation values that were obtained from the special core analysis compared to the network's estimated or predicted water saturation.
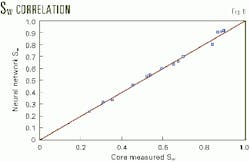
One can conclude that, although water saturation values cover a wide range, the network followed the trend very closely. Also, plotting measured values vs. network predictions displayed a divergence of the predictions from a perfect match, which is the unit slope line (Fig. 6).
Moreover, water-saturation estimations or predictions resulted in a correlation coefficient of 0.9968 where 1.0 is a perfect match. Also, the resulting maximum absolute error and average absolute error from the ANN model are 4 and 1.4%, respectively.
The power of artificial neural network for pattern recognition can be noted by comparing the ANN model with the modified Berg model, which was considered as a correct reference for comparison of other shaly models also for the Bahariya formation.12
It should be mentioned that it is essential to have enough data to train the neural network properly to obtain repeatable results. As in other cases, the results are as good as the data, but with the difference that with proper data, a neural network provides more options than other tools.
Predicting or estimating the water saturation without core data by using a self-organization neural network will be investigated in the future.
References
- Archie, G.E., "The electrical resistivity logs an aid in determining some reservoir characteristic," AIME Transactions, Vol. 146, No. 54, 1942.
- "The low down on low resistivity Pay" Oilfield Review, Vol. 7, No. 3, 1995.
- Hamada, G.M., "Welllog evaluation of low resistivity sandstone reservoir," Third Nordic Symposium on Petrophysics, Sweden, 1997.
- Hanai, T., "Theory of Dielectric Dispersion Due to The Interfacial Polarization and Its Application To Emulsion," Vol. 171, Kolloid-Zeitschrift, 1960, pp. 23-31.
- Hossin, A., "Cacul des Saturations en Eau par la Methode du Ciment Argileux (Formule d'Archie Generalisee)," Bull. Asdosc. Francaise Tech., 1960, p. 140.
- Simandoux, P., "Dielectric Measurements on Porous Media, Application to the Measurement of water saturation, Study of the Behavior of Argillaceous formations," Revue de l'institut Francais du petrole, Vol. 18, Supplementary Issue, pp. 193-215 Translated in shaly-sand reprint volume, Part 4, SPWLA, Houston, 1963, pp. 97-124.
- Log Interpretation-Principles and Applications, Schlumberger Educational Services, 1987, pp. 107-125.
- Alfosail, K.A., and Alkaabi, A.U., "Water saturation in shaly formation," SPE, Mar. 15-18, 1997, pp. 555-63.
- Waxman, M.H., and Smits, L.J.M., "Electrical Conductivity in Oil-bearing Shaly Sand," JPT, February 1968, pp. 107-32.
- Clavier, C., Coats, G., and Dumanoir, J., "The Theoretical and experimental Bases for the Dual Water Model for the Interpretation of Shaly Sands," JPT, April 1984.
- Bassiouni, Z.A., and Lau, M.N., "Development and Field Applications of Shaly Sand Petrophysical Models, Part III," SPE Paper No. 20388, 1990.
- Dawood, A.M., Ibrahim, A.A., and El-Tayeb, S., "Estimation of Hydrocarbon Saturation in Low Resistivity Formation, Part III," Symposium of SPE Egyptian Section, for Computer Application, 1999.
- Patchett, J.G., and Rausch, R.W., "An Approach to Determine Water Saturation in Shaly Sands," JPT, Vol. 19, 1967, pp. 1395-1405.
- Larionov, V.V., Bore Hole Radiometry, Nedra, Moscow, 1969.
- Martin, T.H., Demuth H.B. and Beale, M., Neural Network Design, PWS Publishing Co., Boston, 1999.
- Nikravesh, M., et al., "Prediction of Formation Damage during Fluid Injection into Fractured, Low Permeability Reservoirs via Neural Networks," SPE Paper No. 31103, 1996.
The author
Eissa Mohamed El-Moghawry Bayoumi Shokir is an assistant professor in the petroleum engineering department, Cairo University. He is also working on a part-time basis in the Arab Academy for Science & Technology, College of Engineering & Technology. Shokir holds a BS and an MS in petroleum engineering from Cairo University, and a PhD in petroleum engineering, from the Institute of Petroleum Engineering, Technical University, Clausthal, Germany.
