Empirical correlations help design frac packs
Eight empirical correlations, simple to use with a handheld calculator, were developed to help design frac pack.
The correlations estimate fracture closure pressure, Young's modulus, leak-off coefficient, maximum bottomhole fracture treatment pressure, areal proppant concentration, fracture half-length, fracture toughness, and fracture conductivity
A frac pack can significantly increase production from a hydrocarbon reservoir. It can be designed with commercially available computer software programs, but these usually require large amounts of field data that are not readily available and are, at best, difficult to find.
The commercial software packages also require reasonably sophisticated computing facilities for their execution and substantial time for an engineer to become proficient in their use.
The new correlations quickly provide software packages for all the needed critical input parameters, which may not be readily available from other sources. The correlations may also be used to determine fracture design parameters without the use of a simulator.
The data from frac packs of several gas wells were analyzed and compared with the design parameters that were generated with a commercial software package. The regression coefficients for these correlations range from 0.99 to 0.80, and their average deviation lies between 4 and 24%.
Frac packs
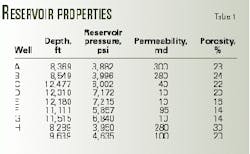
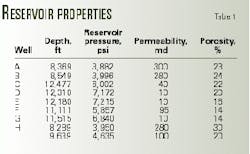
The analysis included data from frac packs in nine gas wells, 250-300-ft water depths, 6,500-12,500-ft subsea reservoir depths. Wells A, B, H, and I in the upper part of the field have clean sands and exhibit a high 20-30% average porosity (Table 1) and an average 100-300 md permeability. The deeper wells C, D, E, F, and G have more laminated sands with 14-22% average porosity and 10-100 md average permeability.
The need for input data in fracture simulation programs is often a serious drawback for the completions engineer. Data needed include leak-off coefficient, fracture closure pressure or fracture gradient, Young's modulus, formation permeability, and fracture toughness.
At the prefrac stage little is known about the geomechanical properties of the formation but the reservoir pressure is usually known to a reasonable degree of accuracy. It, hence, is advantageous to predict some geomechanical properties from reservoir pressure.
It also is desirable to know the maximum expected treatment pressure and consequent horsepower requirements for the ideal design of areal proppant concentration (APC). Correlations for estimating key input parameters for frac-pack design simulations are an asset to the completions engineer.
Papinczak and Miller described the correlations used in the Meereenie field to develop stress profiles for fracture modeling.1 They found strong correlations between:
- Young's modulus and porosity.
- Closure pressure and reservoir pressure.
Halliburton has shown that Young's modulus for poorly consolidated formations increases linearly with confining pressure.2 Because reservoir pressure has been shown to increase linearly with minimum horizontal stress (closure pressure), a correlation between Young's modulus and reservoir pressure may be expected for an unconsolidated formation.
Also, a correlation between Young's modulus and reservoir depth is to be expected because confining stress tends to increase with depth.
Wong presented a correlation between fracture width and APC for propped fractures.3 Economides and Nolte have shown that for a hydraulic fracture, the width is proportional to net fracture pressure and varies inversely as the Young's modulus.4
Hence, one may expect a correlation for propped fractures created with tip-screenout among APC, net treatment pressure, and Young's modulus.
Fluid leak-off depends on the pressure difference between the fluid filling the fracture and formation pore pressure. Hence, one may expect a correlation between leak-off coefficient and reservoir pressure.
Fracture toughness relates the pressure required to propagate a fracture with the dimensions of the fracture. Because this pressure (net pressure) depends on Young's modulus and fracture dimensions, one may expect a radial-type fracture to have a correlation among fracture toughness, Young's modulus, and fracture length.
This article presents correlations for estimating:
- Fracture closure pressure from reservoir pressure.
- Young's modulus from reservoir pressure.
- Young's modulus from perforation depth.
- Maximum treatment pressure from fracture closure pressure, Young's modulus and areal proppant concentration.
- Leak-off coefficient from reservoir pressure.
- Fracture conductivity from areal proppant concentration.
- Fracture half-length from Young's modulus.
- Fracture toughness from Young's modulus and fracture half-length.
Overburden stress
The study evaluated overburden stress by integrating the bulk density wireline log from the surface to reservoir depth.5 This was used to determine the overburden gradient of 0.98 psi/ft using a software program. This value was then used in Terzaghi's equation for determining the closure pressure. Biot's poroelastic constant was assumed to be unity.
Fracture closure, reservoir pressure
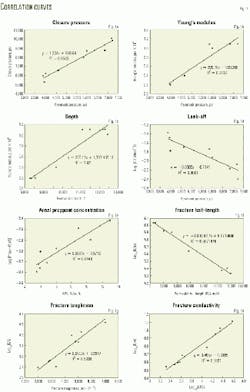
The fracture closure pressure for each pay zone was determined from minifrac pressure decline analysis. Analysis of the step-rate test aided the determination of the fracture closure pressure from the minifrac pressure decline. This was used to plot fracture closure pressure vs. reservoir pressure (Fig. 1a).
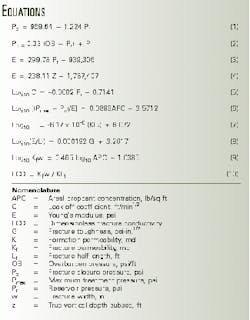
The straight line fitted to the points has a 0.96 regression coefficient. Equation 1 (see equation box) gives the correlation governing these two variables.
In Equation 1, Pc is the fracture closure pressure (psi), and Pr is the reservoir pressure (psi).
Terzaghi's relationship may be used for determining the minimum total horizontal stress.6 Once a fracture has been initiated, the pressure necessary to hold the fracture open (in case of a vertical fracture) will be equal to the minimum horizontal stress.7 This stress is often referred to as "closure stress."
For a Poisson ratio of 0.25 and negligible tectonic component, this relation may be expresssed as Equation 2. In Equation 2, OB is the overburden pressure (0.98 psi/ft).
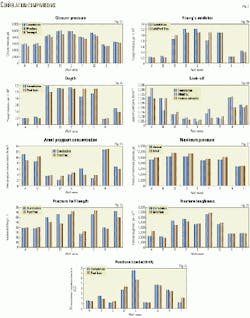
Fig. 2a shows a comparison of closure pressures determined from the proposed correlation, minifrac analysis, and Terzaghi's equation. The proposed correlation predicts closure pressures with a 0.4-10.0% deviation range and a 4.0% average deviation. Terzaghi's relation has a 1.0-12.6% deviation range with a 8.0% average deviation.
Terzaghi's relation consistently predicted significantly lower values for closure pressure than the proposed correlation for most of the wells studied. This results in lower fracture gradients with the possibility of failure to initiate a fracture.
Reservoir pressure
Laboratory tests determined Young's modulus for Wells A, B, D, and E. For the other wells, it was determined from minifrac net pressure history match. Measured values of Young's modulus are preferable. This emphasizes the need for full-hole cores in each producing horizon.
Bottomhole pressure gauges, as well as extrapolation of the minifrac pressure decline, provided data on the reservoir pressure.
Fig. 1b shows Young's modulus plotted against reservoir pressure. The best-fit line has a 0.91 regression coefficient. Equation 3 shows the relationship governing these two variables. In Equation 3, E is Young's modulus (psi).
Equation 3 may be used for estimating Young's modulus from reservoir pressure. Fig. 2b compares Young's modulus determined from the proposed correlation and values obtained from laboratory tests and post-frac analysis. This correlation has a 0-30.0% deviation range and a 12.2% average deviation.
Well depth
Fig. 1c plots Young's modulus against well depth. The regression coefficient for the best-fit line is 0.92. Equation 4 gives the correlation governing these two variables. In Equation 4, Z is the true vertical depth subsea (ft).
Equation 4 may be used for estimating Young's modulus from well depth. Fig. 2c compares values obtained from the proposed correlation with values obtained from laboratory tests and post-fracture analysis. This correlation gives a 0-27.5% deviation range and a 14.9% average deviation.
Leak-off coefficient
Fig. 1d plots leak-off coefficient against reservoir pressure. The correlation governing these two variables fits the available data with a 0.80 regression coefficient and is given by Equation 5. In Equation 5, C is the leak-off coefficient (ft/min1/2).
Fig. 2d compares the leak-off coefficients obtained from the proposed correlation, prefrac estimates, and minifrac analysis. The proposed correlation has a 1.6-46.0% deviation range and a 23.7% average deviation.
The correlation may be used for estimating leak-off coefficients in the early stage of frac-pack design. Final design should be based on values obtained from minifrac analysis.
Maximum treatment pressure, APC
Pressure data supplied by the pumping company determined the maximum bottomhole treatment pressure.
The ratio of proppant weight to fracture surface area is the "areal proppant concentration" (APC). APC was determined from post-fracture simulations. Though small, there was a definite rise in the net treatment pressure in each fracture treatment confirming the attainment of tip screenout.
Maximum net pressures ranged from 350 to 1,000 psi and maximum treatment pressures ranged from 6,500 psi in Wells A and B to 10,500 psi in Wells D and E.
Fig. 1e shows the relationship between log10[(Pmax - Pc)/E] and APC. The correlation has a 0.84 regression and a 1.5-55.0% deviation range with a 22.6% average deviation. Equation 6 expresses this correlation, in which Pmax is the maximum treatment pressure.
Fig. 2e compares APC values obtained with the correlation and those obtained from post-fracture simulations. Fig. 2f shows the actual maximum treatment pressures in low APC wells and ideal maximum treatment pressures required to produce an APC of 8 lb/sq ft.
Fracture half-length
Fig. 1f plots log10E against KLf. This correlation (Equation 7) fits the available data with a regression coefficient of 0.99, in which K is formation permeability (md) and Lf is fracture half-length (ft).
Fig. 2g compares fracture half-lengths derived from Equation 7 and those obtained by post-fracture simulation. The correlation has a 2.5-37.5% deviation and a 13.4% average deviation.
The correlation is sensitive to small changes in Young's modulus and may be used for verifying the Young's moduli obtained from other correlations. For example, a 10% increase in Young's modulus could result in a 90% decrease in fracture half-length.
If one assumes a radial geometry for the fractures, the fracture height will be twice the fracture half-length.
Fracture toughness
The fracture toughness of each pay zone was determined from a suitable history match of the pressure decline data from the minifrac treatment. The value obtained was subsequently adjusted based on post-frac analysis.
Fig. 1g plots log10(E/Lf) vs. fracture toughness. The correlation (Equation 8) between these variables fits the available data with a 0.89 regression coefficient. In Equation 8, G is fracture toughness (psi-in.1/2
Fig. 2h compares fracture toughness obtained from minifrac and post-frac analysis and the proposed correlation. The correlation has a 0.1-31.0% deviation and a 9.2% average deviation.
Fig. 1h plots log10Kfw and log10APC. The correlation (Equation 9) between these variables fits the available data with a 0.97 regression coefficient. In Equation 9, Kf is fracture permeability (md) and w is fracture width (in.).
The correlation has a 4.1-35.4% deviation and a 14.6% average deviation.
Equation 10 obtains the dimensionless fracture conductivity (FCD)
Fig. 2i compares FCDs derived using this correlation with those obtained by post-frac analysis. Average values agree within 17%.
Correlations
Table 2 shows the deviation range and the average deviations of the various correlations presented in this article. A summary of the average deviations is as follows:
Simple correlations provide quick initial estimates of design parameters and are useful in first-pass screening of wells for frac-pack jobs. The correlations in this article were developed with limited core data. Their accuracy would improve with additional core and field data.
Full-hole cores should be taken from each pay zone targeted for completion. Appropriate laboratory testing of these cores will provide these data. It is worth noting that the cost of obtaining these data, which would significantly improve in-house frac-pack designs, could be quickly off-set by the substantial gains in production from properly designed frac packs.
Care should be taken in using these correlations because the reservoir pressure and other properties are unique to this reservoir study and they may vary with time. Warpinski concluded that a complete geologic stress history analysis must be performed because of the changes in pore pressure, temperature gradients, consolidation, and diagenesis with time.8
The correlations provide input data for current 2D and pseudo-3D simulators. These simulators assign a single leak-off coefficient to the entire fracture treatment but this practice may not be sufficient for gas well applications.9 Fan and Llave have presented a more rigorous model for pressure dependent leak-off in gas wells.10
References
- Papinczak, A., and Miller, W.K., "Fracture treatment design to overcome severe near wellbore damage in a moderate permeability reservoir, Meereenie Field, Australia," SPE Paper No. 25379, 1993.
- Frac and Pack Completion Services, Halliburton Energy Services.
- Wong, G.K., Fors, R.R., Cassassa, J.S., Hite, R.H., and Shlyapobershy, J., "Design, Execution and Evaluation of Frac and Pack Treatments in Unconsolidated Sand Formations in the Gulf of Mexico," SPE Paper No. 26563, 1993.
- Economides, M.J., and Nolte, K.G., Reservoir Simulation, 2nd Edition, Prentice Hall, New Jersey, 1989.
- Skopeo, R.A., "Rock Characterization in Reservoirs Targeted for Horizontal Drilling," JPT, December 1993, pp. 1168-75.
- Log Interpretation Principles & Applications, Schlumberger.
- Ahmed, U., "Fracture height prediction," JPT, July 1988, pp. 813-15.
- Warpinski, N.R., "Elastic and viscoelastic calculations of stresses in sedimentary basins," SPEFE, December 1989, p. 522.
- Fan, Y., and Economides, M.J., "Fracturing Fluid Leak-off and Net Pressure Behavior in Frac and Pack Stimulation," SPE Paper No. 29988, 1995.
- Fan, Y., and Llave, F.M., "Tip Screenout Fracturing of Gas Wells," SPE Paper No. 35636, 1996.
The authors
Tennyson Jagai is a lecturer in the petroleum-engineering unit, department of chemical engineering, University of the West Indies, St. Augustine, Trinidad. He previously worked in the petroleum industry as a production and reservoir engineer. Jagai has a masters in philosophy and a PhD in petroleum engineering from the University of the West Indies.
Charlie Baynes is currently pursuing an MS in exploration geophysics at the University of Leeds, UK. Baynes holds a BS in physics and chemistry and an MS in petroleum engineering from the University of the West Indies.
