Numerical approximation improves well survey calculation
It is now possible to improve the precision of well survey calculations by order of magnitude with numerical approximation.
Although the most precise method of simulating and calculating a wellbore trajectory generally requires more calculation than other, less-accurate methods, the wider use of computers in oil fields now eliminates this as an obstacle.
The results of various calculations show that there is a deviation of more than 10 m among the different methods of calculation for a directional well of 3,000 m.1 Consequently, it is important to improve the precision and reliability of survey calculation-the fundamental, necessary work of quantitatively monitoring and controlling wellbore trajectories.
Inclinometers can only give parameters from separate survey stations and cannot give the real profile of wellbore trajectory. Therefore, every method of survey calculation is based on some assumptions, and most of them in each course are straight lines, polygonal lines, cylinder helixes, or circular arcs.2 3 These models are simple, but they are not precise enough for exceptional wells such as extended-reach wells and multiple-target wells.
Theoretical basis
Engineering areas such as mathematics, mechanics, and other disciplines have used spline function since I.J. Schoenberg proposed it in 1946. The spline, made of a slender batten or other elastic material, was originally a simple device used for drawing a curve. Users lay it on the plate, put some paperweights on it, and form it into the shape of the given curve. When the bending deflection of the spline is tiny, Equation 1 can express the equation of its shape (see equation box).
Engineers can regard the spline as an elastic, slender beam, and the elementary theory of beams shows that the curve Equation 1 expresses is the shape of the beam loaded with a series of concentrated forces. The whole curve consists of sectional, cubic curves.
The first and second derivatives on the whole curve are continuous, and the inflection points are at the paperweights. With regard to efficacy, the paperweights operate simply as support points.
Mathematical spline is the curve that a series of sectional cubic curves approach on the elastic curve of a drawing spline. Its continuity is through to the second derivative, and its third derivative skips being continuous at the inflection points.
For many important engineering applications, the mathematical model of the drawing spline is highly accurate and true to nature.
During the process of drilling, the deformation of the drillstring is limited to the wellbore wall, and the contact points can be simplified as a series of fulcrums.
These fulcrums equal the paperweights used in a curve drawing, and the whole drillstring makes up a kind of elastic slender beam. Furthermore, a wellbore trajectory is continuous and smooth. Consequently, the drillstring in a wellbore is an elastic spline, and in every way simulates a wellbore trajectory using the spline function.4
In order to discuss the behavior of a function relation that has no explicit expression-such as that on some experiments' datasheets, observations, or surveys-it is common first to make an approximate mathematical relation. Interpolation is effective for creating such an approximate function. There are many interpolation methods, but the interpolating function of cubic spline is the best and the most common choice.
Trajectory spline function
Depth, inclination, and azimuth are the three essential parameters for determining trajectory, and, based on them, the engineer can calculate other parameters to simulate a real trajectory. As a rule, depth is the independent variable among these parameters.
For the whole trajectory or a part of it, assuming that there is a series of measured results arranged in the order of survey depth:
If a(L) and f(L) are no more than cubic multinomials over subinterval [Li, Li + 1], and they have the continuous first and second derivatives over [a,b], and they meet Equation 2, then a(L) and f(L) are termed the inclination spline function and the azimuth spline function, respectively, based on the nodes {Li}.4According to the definitions of inclination spline function, Equation 3 can express a(L). Except for the measured parameters, the equation shows that a(L) only relates to the second derivatives, mi, which meet the relations shown as Equation 4. But, because there are only n - 2 equations available here for n unknowns, (m1,m2, ..., mn), there is a need for two more equations for the ends of the simulated trajectory.There are generally three ways to give these supplementary equations:4
- When the rate of inclination change expresses as the first derivative, if å1 and ån are known, then Equation 5 can determine the boundary equations.
- When the curvature of the inclination curve expresses as the second derivative, if ä1 and än are known, then Equation 6 can determine the boundary equations.
- Undoubtedly, however, the best way to give the boundary condition from the first and the last several survey stations is: If cubic interpolation multinomials are used, then Equation 7 can determine the boundary equations.
Similarly, Equation 8 can determine the azimuth spline function.
Trajectory curvature, torsion
A wellbore trajectory generally is a curve in space that is both curved and tortuous. For many years, engineers have focused critical attention on the trajectory curvature, regarding it as an important index.5-7
Drilling practice shows, however, that a tight trip sometimes occurs even if trajectory curvature is not high and weight on bit cannot be applied successfully during regular drilling, especially when bent subs or houses are in the drillstring.
The research results show that the value of trajectory torsion is usually higher than that of trajectory curvature and changes more sharply. Evidently, there are many factors that influence frictional resistance-bottom hole assembly, hole curvature, inclination, performance of drilling mud, hole condition, and a difference in the degree of influence between hole curvature and its torsion.
Research also shows, however, that frictional resistance greatly increases as the drilling string is twisted in the tortuous hole even if its deflection is not as considerable. Therefore, hole torsion is another important parameter for describing and calculating a wellbore trajectory.8
According to the definitions, the parameters relating to the hole curvature and torsion can be calculated by Equations 9, 10, and 11.9-11
Survey calculation
Based on the idea and theory discussed previously, there are two methods for describing and calculating a drilled wellbore trajectory-the curve structure method and the numerical integral method.
In the curve structure method, according to the theory of curve, the shape of a curve in a vicinal area depends on its structural elements. For example, an arc can be the curve in which k = constant and t = 0.Evidently, the results are more precise when the hole curvature and torsion are synchronously involved over every course length. Thus, it is reasonable to simulate a wellbore trajectory using the curve structural theory.
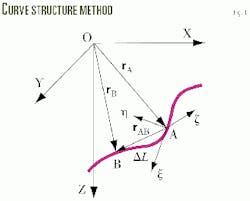
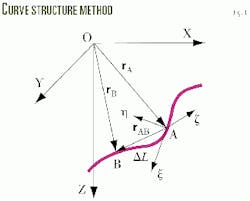
Fig. 1 illustrates this method. When the coordinate system O - XYZ exists, then Equation 12 can express the Position B relative to Position A on a 3D trajectory.
And when the coordinate system A - xh z exists in the axis directions of tangent, principal normal, and binormal, Equation 13 can express rAB.From the definitions of trajectory parameters and the theories of curve structure and analytic geometry, the transformation correlation of the two coordinate systems appears as Equation 14.12
Click here to view Equations
This survey is in PDF format and will open in a new window
The method uses the structural elements at the upper point A to calculate the course coordinates of wellbore trajectory. Apparently, it can be the same with the lower point B.
It is not hard to imagine that the calculation precision will be improved if the two points of the course ends are used. In this case, Equation 15 can calculate the course coordinates.
The second method is the numerical integral method.
The basic idea of spline interpolation function is to express a spline curve as sectionalized polynomial expressions, to turn the whole function into an erectable one, and to keep the curve smooth at the nodes. It is very suitable to a numerical calculation because such a function has kept the elegance of polynomial expression and overcomes its shortcomings on agility and stabilization.
After determining the inclination spline function and the azimuth spline function using Equations 3 and 8, the engineer can then use Equation 16 to calculate the course coordinates based on the differential model of wellbore trajectory.
Because it is not easy to find the object function in Equation 16, it is generally advisable to obtain the result through numerical integral. This is the basis for the method name.4 11
Verification
We chose two typical theoretical curves-a cylinder helix and an arc curve in space-to verify the calculated results of these methods and to compare the results with those from the commonly used methods in the oil field.
In the calculations for the following two examples, the parameters at the upper survey station are the same:aA = 30°, fA = 50°, and DL = 30m, but aB and fB need determination according to the given curves.In the first example, assume the course to be a cylinder helix curve. Its curvature in a vertical plot is kV = 8°/30 m, and its curvature in a horizontal plot is kH = 12°/30 m. Based on the characteristics of a cylinder helix, the inclination and azimuth at the lower survey station can be obtained: aB = 38°, and fB = 56.7049°.Table 1 shows the detailed calculated results from the different methods.
In the second example, assume the course to be an arc curve in space. Its curvature is k = 8°/30m, and its initial tool-face angle is v = 60°. So the inclination and azimuth at the lower survey station are: aB = 34.6335°, and fB = 62.2440°.Table 2 shows the detailed calculated results from the different methods.
With respect to the cylinder helix, the calculated results of the radius of curvature method are exact. With respect to the arc curve in space, the calculated results of minimum curvature method are exact.10
The errors in Tables 1 and 2 are the square roots of the square sum of the single coordinate error between the calculated result and the exact solution with north course coordinate, east course coordinate, and course vertical depth.
The error of the minimum curvature method in Table 1, for example, is shown below:
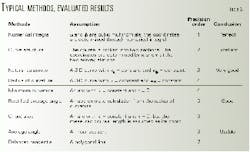
The example results and many actual calculated figures in the oil fields indicate that the order of calculated precision for the commonly used methods is as shown in Table 3. Precision order in the table only means the relative order, not the exact grade, in respect to its calculated precision.
For example, the result of the curve structure method is inferior to that of the numerical integral method but superior to that of other methods. The results of the rectified average angle method are generally very close to that of the radius of curvature method, but it ranks lower only because it is an approximate calculation. It is important to choose the most appropriate method, especially for exceptional wells. Currently, calculating course coordinates through numerical integral is the most precise method to simulate and calculate a wellbore trajectory.
References
- Zhiyong, H., "On Problem of Selecting Wellbore Survey Calculation Methods," Petroleum Drilling Techniques, Dezhou, China, March 1989, No. 1, pp. 14-17.
- Craig, J.T. Jr., and Randall, B.V., "Directional Survey Calculation," Petroleum Engineer International, March 1976, pp. 38-45.
- Callas, N.P., Novak, P.C., and Henderson, J.R., "Directional Survey Calculation Methods Compared and Programmed," OGJ, Jan. 22, 1979, p. 53.
- Xiushan, L., et al., "How to Simulate Actual Well Trajectories with Spline Function," Journal of Daqing Petroleum Institute, Anda, China, March 1991, No. 1, pp. 45-51.
- Lubinski, A., "Maximum Permissible Dog-Legs in Rotary Boreholes," J. Pet. Tech., February 1961, pp. 175-194.
- Lubinski, A., and Woods, H.B., "Factors Affecting the Angle of Inclination and Dog-Legging in Rotary Bore Holes," Drill. and Prod. Prac., API, 1953, pp. 222-242.
- Wilson, G.J., "Dog-Leg Control in Directional Drilled Wells," J. Pet. Tech., January 1967, pp. 107-12.
- Shan, W., Xiushan, L. et al., "The Shape of the Space Curve of Borehole Trajectory," Journal of Daqing Petroleum Institute, Anda, China, September 1993, No. 3, pp. 32-36.
- Wilson, G.J., "An Improved Method for Computing Directional Surveys," J. Pet. Tech., August 1968, pp. 871-76.
- Xiushan, L., Zaihong, S., and Sen, F., "Natural parameter method accurately calculates wellbore trajectory," OGJ, Jan. 27, 1997, p. 90.
- Xiushan, L., et al., Designing Theory and Describing Method for Wellbore Trajectory, Heilongjiang Science & Technology Press, Harbin, China, 1993.
- Xiushan, L., et al., "The Curve Structure Method of Borehole Trajectory Calculation," Acta Petrolei Sinica, Beijing, China, July 1994, No. 3, pp. 126-33.
The authors
Liu Xiushan is a senior engineer at Sinopec Corp.'s Exploration & Production Research Institute in China. He has a BS and an MS from Daqing Petroleum Institute and a PhD from Research Institute of Petroleum Exploration & Development of CNPC, all in petroleum engineering. His professional experience includes work as an associate professor at Daqing Petroleum Institute and as a postdoctoral fellow at Tsinghua University.
Shi Zaihong is reading for her PhD at the Institute of Mechanics of the Chinese Academy of Sciences in China. She received her BS and MS in petroleum engineering from Daqing Petroleum Institute. Her professional experience includes work as an associate professor at Daqing Petroleum Institute and Tsinghua University.


