Model predicts more accurate PI over a field's life
A model, using the vertical lift performance (VLP) for each oil producing well in a UK North Sea oil field, improved the predictions of the productivity index (PI) over the field's life.
The new method was developed because the original matched model for predicting the PI worsened over time.
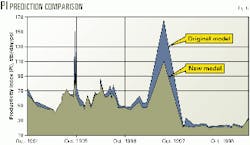
The instability of the original PI prediction model is seen as a series of peaks and troughs in Fig. 1.
A well's PI in stock-tank bbl per day per psi (stb/day/psi) is the total rate at which a well can produce at surface for a given pressure drawdown, assuming that the bottomhole pressure remains greater than the bubblepoint pressure.1 2
The study that developed the new model investigated whether the PI predictor's behavior was due to inconsistencies in the pressure-volume-temperature (PVT) model, to effects caused by increasing water cut, or to the fact that different VLP correlations may be needed at different times in a field's life.
An inability to predict a well's performance accurately over time causes forecasts of future production and hence its contribution to company cash flow to become uncertain.
VLP curves
The following five steps are used to predict a PI from VLP curves.
- Create a PVT model of the produced hydrocarbon by matching laboratory data with black-oil correlations.
- Obtain total liquid rate, wellhead pressure, and water cut from surface measurements at a given date, such as from well tests.
- Input the PVT model and the rate, wellhead pressure, and water cut into a VLP simulation model to derive a corresponding flowing bottomhole pressure.
- Determine reservoir pressure via interpolation of recorded values for the same date.
- Compute the well PI for that date.
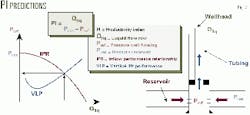
Fig. 2 shows the relationship between the PI equation and the VLP model.
Consistent PVT model
Before running any useful VLP simulations, one needs to have an accurate PVT model to predict reservoir fluid behavior along the tubing. Various references discuss PVT models.3-5
The original PVT model for the UK field did not appear to be derived from standard procedure usually applied to PVT measurements used for black-oil correlations; and therefore, a new, black-oil PVT model was developed.
Black-oil correlations are empirical observations from real fields, with data gathered from separators and stock tank. When matching these correlations with PVT data, one needs to specify the separation processing stage from which the data were obtained.
For example, if matching GOR, one should sum the GOR at each separation stage. Also, the specific gravity of the produced gas is calculated as a volume-weighted average of the gas evolved at the separators and stock tank. The oil specific gravity, however, is obtained from the oil in the stock tank after the separation process.
Black-oil correlations are expressed in different ways to compute one variable at a time; therefore, it is important that all input variables be consistent with each other.
For the field, it was noted that some PVT reports could be grouped together on the basis of similar fluid properties. Thus, an area-by-area analysis was carried out.
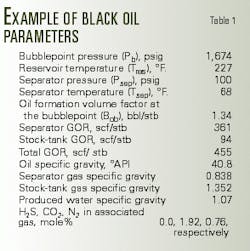
Black-oil parameters for each area were generated and used as regress parameters to create black-oil tables, such as illustrated in Table 1.
The Vazquez-Beggs black-oil correlation best matched the field data for bubblepoint pressure, solution gas-oil ratio, and oil formation volume factor, while the Beggs correlation was best for predicting oil viscosity.
After the PVT match was made consistent for each well under investigation, it was observed that one particular PVT table would suffice for all wells without altering the overall VLP performance. That table, therefore, was applied throughout the field.
VLP simulaton
VLP simulations need the following data:1 6
- Directional well survey to relate drilled depth with true vertical depth.
- Completion string details for internal tubing diameters.
- A matched PVT model for predicting density and viscosity changes of the produced fluid, and hence the pressure drop as fluid travels to surface.
- Total liquid rate and water cut.
- Corresponding wellhead pressure and temperature.
- Corresponding bottomhole pressure and temperature to match the VLP model.
These data are gathered from numerous sources, including the well completion tubular tally, daily production reports, monthly separator tests, static bottomhole surveys, flowing gradients, and production logs.
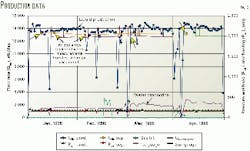
Fig. 3 illustrates the surface data recorded for a single oil producer in a few months. Note the difference between the liquid flow rate from daily production measurements and those from separator test measurements.
To ensure the PI prediction model was the best available, the study defined the following three criteria to be met by the match data:
- Availability of test separator data. Most production flow rates are allocated values derived from the manipulation of the total field production on the basis of an assumed GOR. The separator test values, however, are derived from testing a single well at a given time.
Thus for the study, it was decided that these values should be used for the VLP model. This significantly reduced the number of points to be compared with the pressure surveys because of the limited number separator tests, usually no more than three per month. - Availability of flowing bottomhole pressure measurements. In the study, the pressure surveys did not cover the entire production time for each well.
- Availability of data from a well under steady-state flow conditions or in other words stable. VLP correlations only work for steady-state regimes; therefore, separator test data not in a steady state were eliminated.
The application of this criterion to the well production history shown in Fig. 3 indicated that in a 4-month period, only three data points qualified for input to the VLP simulation model.
VLP correlations
VLP correlations involve some basic concepts.5-7 Initially, wells produce with a two-phase flow regime of oil and associated gas. Gas is released from the oil as fluid flows to surface. Water cut is zero at an early production stage, but fluid behavior modeling becomes more complex as this third phase begins to be produced.
Each phase flows up the tubing at a different average velocity, depending on its density. The lighter the density, the faster the phase travels for a given pressure drop. Slip velocity is the velocity difference between the lighter and heavier phase.
Because the two phases move at different speeds, at different points in the tubing the percentage of each phase differs from its percentage going in or out of the tubing. This difference is known as hold-up.
The interface between the phases can take a variety of forms. In two-phase flow of oil and gas, the interface distribution is classified into flow regimes or flow patterns that change as the oil travels up the tubing and more gas comes out of solution.
Flow regime maps identify the flow patterns in the well according to the superficial velocity of the gas and the liquid. Fig. 4 shows the flow map derived by Gould, which describes the different flow patterns that can exist in a vertical well flowing oil and gas. Slug flow best describes the flow pattern for the wells in the study.
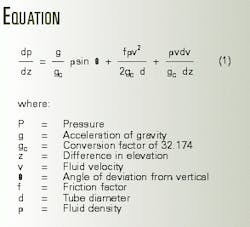
The physical behavior of free gas and liquids flowing in tubing can be modeled with multiphase flow correlations. These correlations only consider liquid-gas interactions and generally lump oil and water together as a single equivalent fluid. The energy balance per unit mass of fluid entering the tubing and flowing at a steady-state rate can be expressed in terms of a pressure gradient as shown by Equation 1 in the equation box.
The subsequent total pressure gradient has three contributing factors:
- Hydrostatic pressure gradient, which is the gravity term that reflects the fluid density and the well deviation angle from vertical. It constitutes about 75% of the total pressure gradient; therefore, an accurate PVT model is essential.
- Friction pressure gradient, which is proportional to the friction factor or pipe roughness. It constitutes about 23% of the total pressure gradient.
- Acceleration pressure gradient, which is generally insignificant, except when the produced fluid velocity is changing rapidly. It constitutes only 2% of the total pressure gradient.
It follows that pressure-loss correlations require the values of gas-liquid ratio, flow velocities, fluid density, and viscosity for the entire range of temperatures and pressures encountered within the well. Pressure gradient calculation accuracy depends on the accuracy of the PVT fluid properties.
VLP modeling
VLP simulation uses a variety of methods as follows:5-9
- Expressing the liquid hold-up and friction losses as a single unique phase energy loss, without attempting to identify flow patterns.
- Evaluating separately the effect of two-phase hold-up and friction losses, without attempting to identify flow patterns.
- Identifying flow patterns and estimating both hold-up and friction losses.
No universal rule exits for selecting the best multiphase flow correlation. The Griffiths and Wallis correlation works well for a bubble flow regime. The Hagedorn-Brown correlation, probably the most widely used in VLP simulations, works best for slug flow conditions. The Duns and Ros correlation gives good results when the gas fraction is very high, such as in annular and mist flow.
Prosper software (Petroleum Experts Ltd., Edinburgh) was used to perform the VLP simulation to match the observed well production data. The program contains an extensive library of VLP correlations including three that Petroleum Experts developed.
Its original VLP correlation uses the Gould flow map (Fig. 4) to identify flow regime. The program then selects the best existing correlation for that flow pattern. This feature addresses one of the perceived problems in the study because the program selects the best VLP correlation for the well throughout its life.
The second Petroleum Experts correlation includes all features of the original, but is better at predicting low-rate VLP and has improved stability. Its third correlation includes all the features of the second but can cope with heavy and foamy oils and has improved accuracy.
In the VLP simulation matching process of Prosper, two matching parameters are reported and should be noted as follows:
- Parameter 1 is a multiplier for the gravity term in the pressure-drop correlation. Initially the hold-up term is adjusted up to a maximum of 5% correction. If a greater correction is needed, then density is adjusted up to a maximum 10% correction. If this is still not enough, then there is probably inconsistency between the fluid density predicted by the PVT model and the observed field data.
- Parameter 2 is the multiplier for the friction term. If a large adjustment is required, the completion description or the reported flow rates may be incorrect.
The closer to 1.0 these parameters are, the better the correlation fits the observed data.
VLP results
Fig. 5 shows the results of the VLP simulations. Note that the Hagedorn-Brown correlation works very well, as it should in slug flow, but the Petroleum Experts correlation No. 3 is closer. The latter correlation, therefore, was selected for all subsequent VLP simulations.
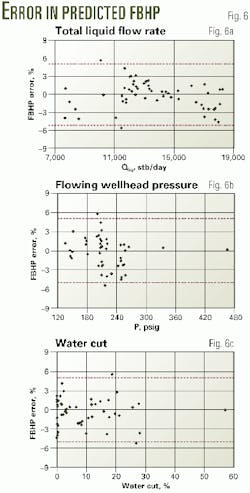
The VLP correlation accuracy was confirmed by its ability to predict flowing bottomhole pressure to within ±5% of the observed value. This accuracy was achieved irrespective of pressure drop, flow rate, or water production amount. Figs. 6a-6c show the results of the VLP simulations.
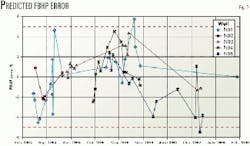
Fig. 7 shows the accuracy of the new model for five of the producing wells. The accuracy was maintained for all wells over time.
PI prediction
Fig. 8 shows the PI prediction from the new model compared with the old model. The new model markedly improved the stability but still causes concern. There was, however, nothing else that could be done to improve the VLP simulation model because:
- The total liquid rate at surface is measured regularly and therefore is tightly constrained.
- The corresponding flowing bottomhole pressure is predicted as well as can be from an enhanced VLP simulation model.
The reservoir pressure term is the only term left that may need to be revised. It is recorded infrequently and is obtained from interpolation with a reservoir simulator. This may be the main source of error in the PI model.
A new reservoir model has been built that allows greater pressure communication between compartments of the reservoir via leaky faults. With this new model, the reservoir pressure history match has improved and hopefully will lead to even better PI predictions.
References
- Golan, M., Whitson, C.H., Well Performance, second edition, Prentice Hall, 1986.
- Dake, L.P., Fundamentals of Reservoir Engineering, Elsevier, 1978.
- McCain,W.D., The properties of petroleum fluids, second edition, PennWell, Tulsa, 1990.
- Bradley, H.B., Petroleum Engineering Handbook, SPE, 1992.
- Prosper User Guide, Petroleum Experts Ltd., July 1996.
- Brown, K.E., The Technology of Artificial Lift Methods, PennWell, 1977.
- Butterworth, D., and Hewitt, G.F., Two-Phase Flow and Heat Transfer, Harwell Series, 1977.
- Govier,G.W., and Aziz, K., The Flow of Complex Mixtures in Pipes, Van Nostrand Reinhold Co., 1972.
- Gould,T.L., Tek, M.R., and Katz, D.L., "Two-Phase Flow Trough Vertical, Inclined, or Curved Pipe," JPT, August 1974.
The authors
Gioia Falcone works as a petroleum engineer in the technical group of Enterprise Oil plc, Aberdeen. Falcone holds a petroleum engineering degree from the University of Rome, La Sapienza, and a MS in petroleum engineering from Imperial College, London.
Bob Harrison is a senior-staff petroleum engineer with Enterprise Oil plc, London. He previously worked with several companies in seismic acquisition, well logging, and petroleum engineering, as well as teaching economics and production logging at Imperial College. Harrison has a BS in electrical engineering from the University of Science and Technology in Manchester, an MS in petroleum engineering from Imperial College, and an executive MBA from Cranfield School of Management.
