Method helps quantify benefits of applying new upstream technology
The value of new technology in the upstream oil & gas business is only realized through its application on assets.
The "look-back" approach outlined in this article allows the assessment of conservative estimate of the realized benefits of new technology. This estimate can subsequently be compared with the costs of development or acquisition of new technology.
Such an evaluation can be used to guide decisions on investment levels for development, testing, and implementation of new technology. It is also needed to convince partners and other stakeholders of the need for such investments, to demonstrate a track record, to monitor improvements over time, and for benchmarking.
Results obtained from such "look-back" studies are of limited value when making decisions for specific technology investments.
For this purpose a forward look approach is required. Approaches are becoming available1-4 but are considered outside the scope of this article.
An asset-based method has been developed and used in Shell since 1995 which uses look-back, structured interviews in facilitated workshops, conservative economic evaluations, and a challenge process. Value is only recognized when the technology is truly new and only when it can be demonstrated that it influenced decisions or actions in the time window considered. The method circumvents the traditional problem of identifying all costs related to the development of a specific technology. The process is executed by the end-users of the new technology with little or no input of the technology providers. As a result the outcomes are conservative by design.
The methodology has been developed in-house and refined over the years through experience and global application in different operating environments. It is applied to all new technology, independent of its source. Benefits can be allocated to assets, technology providers, technologies, and value drivers and are split into cash and value.
The results generally demonstrate the large impact of the application of new technology on Shell's upstream business through cost reductions, production increases, and increased reserves. They also demonstrate a strong creaming effect, as 80% of the benefits are realized by some 20% of the submitted new technology applications.
Repeat evaluations indicate a positive effect of technology management and focus. Future improvements of the approach focus on better assessments of the development cost of new technology from service companies and at obtaining industry benchmark data.
The methodology is now available externally,5 which will eventually allow industry benchmarking of the effectiveness of new technology applications in the upstream oil & gas sector.
Look-back method
As no suitable method for quantification of new technology benefits appeared to be available in 1994, a proprietary methodology was developed in-house meeting the following criteria:
- Auditable, based on established economic practice.
- Fast and efficient, not necessarily super-accurate.
- Conservative to ensure buy-in of critical R&D financiers.
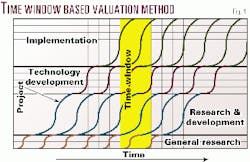
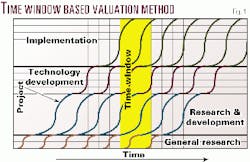
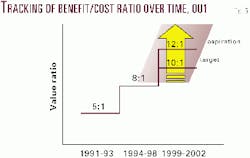
The evaluation method developed compares the costs of technology development and implementation in a 3-5 year time window (e.g. 1994-98) with the commercial benefits realized from decisions to implement the technology taken in the same time window. A time window is used in preference to a project window, since tracing and evaluating the often-complex path leading to the development and application of all relevant new technologies is considered unrealistic. This is too complex, takes too long to be remembered in detail, and the costs of failed attempts would be missed out. In preference, all costs related to technology development and implementation in the 5-year time window are compared with the benefits realized in the same time window (Fig. 1).
This approach is acceptable in a "steady state" type situation. This is a fair assumption in view of the reasonably constant investment level in the development and implementation of new technology in larger companies. Such investment levels will annually fluctuate but in a relatively narrow bandwidth. A period of 3-5 years was selected because such time span is commensurate with the maximum "half life" of R&D benefits and also likely to be within the living memory of the typical interviewee.
Data gathering is based on 2 hr working sessions aimed at collecting the most significant benefits, with the various asset teams of the operating company under review. The technology discipline heads of the operating company are present at the sessions, which are facilitated by an experienced team, consisting of head-office technical and managerial staff and an outside consultant. Sessions have also been focused around assets with similar business challenges, such as carbonates, heavy oil, well engineering, etc. In addition to benefits, the asset teams were asked to identify missed opportunities, new technology failures, learning points, and suggestions for improvements.
After a short presentation by the facilitators on the methodology, the session starts with a structured brainstorm where all participants are asked to make suggestions without being challenged. Care is taken that the discussion is not limited to a few dominant participants. Initial sieving and cursory ranking follow this inventory stage. The remaining potential benefits are then discussed in more detail in ranked order until time runs out. During the discussions the facilitators abstain from "prompting" but challenge the submissions, concentrating on issues such as:
- Is the benefit quantifiable and significant (does it have "top 10" potential)?
- Was a different decision taken as a result of the (technology) benefit claimed (no dreaming)?
- Was there a new technology component? To qualify, the technology should not only be new for the operating company but it must contain an innovative element, a risk element, and an element of development.
- What would have happened without this new technology (alternatives considered)?
Care was taken not to overestimate the duration of the period in which the benefits of a new technology can be enjoyed. As the upstream oil industry is rather open, with intricate partnerships and most of the work being done by contractors, it is very difficult to keep things secret for an extended period. Therefore it was assumed that after a period of 3-5 years the rest of the industry has caught up with the invention and the competitive benefit is lost. Benefits from rotary drilling, new in 1859, obviously did not count, but also the benefits from traditional horizontal drilling, new in the late eighties, were ignored in our studies.
This implies that there is a limited "window of opportunity" to reap the fruits of new technology. This period can be extended by continued developments of the new technology, leading to further improvements, which can be regarded as "new." This issue should be an important aspect in the challenge process, prompted by queries such as, "Could this have been done 10 years ago?"
The process has identified the majority of the benefits (80/20 rule) with a reasonable amount of effort. The total data gathering exercise takes about a week of individual sessions. The total study including evaluation and reporting can be done over a period of a few weeks. The identified benefits are quantified as described below. The sum of the identified benefits is compared with the total costs over the time window in order to arrive at a minimum estimate for the benefit/cost ratio.
Quantification
A distinction has been made between benefits that affect the cash flow in the time window and benefits that have an impact on the future cash flow and hence the value of the company without necessarily affecting the current cash flow.
Cost reductions and increased production have an immediate effect on the cash flow and are therefore particularly valuable in times of low oil prices.
Additional reserves increase the value of the company without necessarily having an immediate impact on the current cash flow.
In a few reported cases it was noted that an improved reserves/production ratio can lead to an immediate cash flow effect from a production ceiling increase. In such cases the discovery of a relatively high cost hydrocarbon accumulation can even result in an immediate increased production of cheaper oil.
The benefits of a typical submission would fall in any of the following categories:
- Reduced costs (capex or opex).
- Increased present value production. ("on tap").
- Pre-development reserves increase.
- Increased exploration scope.
For clarification, the present value production profile is defined as the discounted production profile that can be converted to the present value of the revenues by multiplying it by the assumed oil price. This concept is eminently suitable to be applied to the difference of two production profiles, as is the case for acceleration projects.
Other benefits such as avoided dry holes, faster production start-up, and reduced downtimes were translated into one or more of the above categories. Environmental benefits (e.g. subsidence, clean up) are renowned to be difficult to quantify and imaginative solutions, such as schemes with insurance coverage, were sought.
The quantified benefits were converted into NPVs using a simple economic model based on the local circumstances such as cost levels and fiscal terms. This was done both on the 100% pre-tax basis and on a company share after-tax basis. In all cases the implementation costs associated with the submissions were incorporated in the evaluation. Note that the costs of the technology development were not included in the evaluation of the individual submissions but were of course included in the new technology development costs with which the total benefits were finally compared.
The evaluation methodology was kept as simple as possible. Future production and cost benefits were discounted at the "cost of capital" and a fixed oil price with an appropriate gas conversion factor. This resulted in a simple table with factors, allowing converting cost reductions, increased production and reserves to the desired NPV effects. This simplification allowed "on the spot ranking" of the submissions during the brainstorm sessions and greatly sped up the evaluation. A full-blown cash flow model generally confirmed the largest benefits. In some cases the results were subjectively discounted for chances of failure, reduced new technology impact for the submission, etc.
In some instances further clarification from the original contributors was required to clear up uncertainties and misunderstandings. The evaluations were normally discussed and agreed with the local petroleum economist, particularly for those submissions yielding the largest benefits.
Implementation
The methodology was developed during a 1994 review of the effectiveness of the Shell organization and the R&D function in particular.
During the initial study five larger operating units in different parts of the world participated in the review. Results yielded the benefit/cost ratio of new technology as implemented in these individual companies and allowed an extrapolation to the corporate upstream sector. Benefit/cost numbers ranged between five and ten.
Since then the exercise has been repeated a number of times at the request of operating companies who wanted to demonstrate the value of their technology investments. Several of these companies participated in the 1994 review, and results confirmed the claimed improved effectiveness of R&D following organizational changes.
Some results
Benefits identified originate from a wide range of technologies. The ten highest-ranking benefits from the 1994 study resulted from application of:
- A proprietary integrated basin modeling technology to quantify and time gas charge.
- A proprietary method to measure Archie's saturation exponent "n" for low porosity-low permeability samples.
- A proprietary reservoir simulator to optimize field de-pressurization schemes.
- An innovative fractured reservoir simulator to model oil rim movements.
- A quantitative reservoir souring model to optimize equipment installation.
- A dynamic flexible riser to extend the depth limit of a conventional shallow water development.
- Novel lateral prediction technology for well targeting.
- A proprietary structural tool kit to demonstrate fault sealing in down-thrown fault blocks.
- A proprietary integrated subsurface reservoir modeling technology to increase reserves.
- Remotely operated vehicles, obtained through a partner, for the installation and maintenance of deepwater subsea production systems.
Total pre-tax benefits (for all stakeholders) from the above "top 10" are in excess of $1.5 billion. After the initial cursory ranking, some 318 benefits were submitted for detailed evaluation, of which some further 144 were rejected.
The sum of all accepted benefits amounted to some $3.8 billion. For the five companies visited the total cost for the development and implementation of new technology amounted to some $500 million in the same time window, suggesting a benefit/cost ratio in excess of 7.
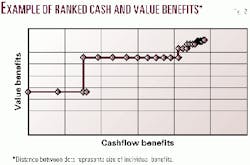
The results demonstrate a strong creaming effect whereby the top 20% of the submissions generate more than 80% of the benefits, another confirmation of Pareto's well-known 80/20 rule. Cumulative benefits for the ranked submissions are plotted in Fig. 2, which was used as a quality check on the submissions. Breaks in the curve for a given company may indicate that significant benefits have been missed or that some have been overrated.
null
Allocation of benefits
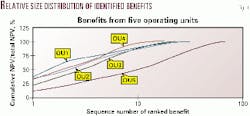
Benefits identified (Figs. 4-5) can be allocated to:
- Specific operating unit: allowing benchmarking, best practice sharing, and time-monitoring of new technology benefits from repeat studies.
- Technology origin: distinguishing benefits from corporate proprietary research, local in-house technology development, and third party contributions.
- Technology area: e.g. subsurface technology, drilling, engineering, etc., allowing a track record of R&D effectiveness for different technology areas.
- Value driver: e.g. increase reserves, reduce capex, reduce opex, and increase production. The relative contributions should be commensurate with maturity of the operating unit, i.e. a company with large ongoing developments should expect large new technology benefits from capex savings (see Fig. 4 for examples).
Discussion
Results of all studies carried out unanimously indicate that investment in new technology pays off handsomely. Moreover repeat studies demonstrate the benefits of targeted technology management.
The studies also indicate significant lost value from not applying available technologies at the earliest possible stage in line with observations made by others.1
It may well be that the upside potential from identified missed opportunities is only the tip of the iceberg as such suggestions can easily be seen as an admission of failure. After all, success has many fathers but failure is an orphan! Clearly the focus should be on improving effective technology implementation through better integration of technology management and asset management, e.g. through regular project reviews.
In the same context it proved difficult to obtain information on the cost of failed implementations of new technology. Here it is important to investigate the reason for the failure. Distinction has to be made between a poor technology product and the erroneous application of a potentially valuable technology.
While it is relatively easy to assess the cost of in-house technology developments, this proves very difficult for externally developed technology. In particular when implemented through contractors, the new technology development cost is "hidden" in the commercial rates and hard to extract.
The value of the results obtained would increase significantly if they could be compared with results in other companies. Such a benchmarking study is currently being pursued.5
Acknowledgments
The authors thank a number of people that played a key role in the development and implementation of this methodology. Frans Driedonks made major contributions in the 1994 studies, and Ante Frens and Adam Lomas contributed to the 1998 and 1999 repeat studies. We thank SIEP and the participating operating companies for their support and permission for publication.
References
- Oligney, R.E., and Economides, J., "Technology as an asset," Hart's Petroleum Engineer International, September 1998.
- "Scientific management at Merck: An interview with CFO Judy Lewent," Harvard Business Review, January-February 1994, p. 89.
- "How SmithKline Beecham makes better resource-allocation decisions," Harvard Business Review, March-April 1998, p. 45.
- Hamel, G., "Bringing Silicon Valley Inside," Harvard Business Review, September-October 1999, p. 71.
- Arthur D. Little, "Value creation through technology: Industry proposal," May 2000. Contact: [email protected]
The authors
Rob Jonkman is an independent consultant after a nearly 30-year career in Royal Dutch/Shell Group as a geophysicist and petroleum economist. He has a PhD degree in physics and specializes in petroleum economics, oil legislation, and decisionmaking processes. E-mail: [email protected]
Hans de Waal is global technology implementation manager with Royal Dutch/Shell with 23 years' experience in the development, implementation, and dissemination of technology. He is presently involved in global technology implementation. His tenure with Shell involves petrophysical research and technology management. E-mail: [email protected]
