Empirical correlation corrects fluid density logs
A simple empirical friction correction allows for the interpretation of previously uninterpretable differential-pressure density logs.
This second in a three-article series (Part 1, OGJ, Dec. 4, 2000, p. 57) explains a method for correcting differential-pressure density logs run in wells producing at high flow rates.
The first part covered the basics of two-phase production log interpretation, and the concluding part will discuss third-party software and a new nonlinear regression method to correct for friction effects.
Without these corrections, these commonly run density logs will not attribute the correct oil and water production to the appropriate producing interval. This may lead to poor workover decisions and suboptimal recovery from a reservoir.
Preventing friction effects
Choking back wells prior to logging is the authors' preferred method for preventing friction effects on commonly run differential-pressure density tools. But some would argue that choking back the well might alter the profile and the flow regime. This change might lower the drawdown and allow crossflow into depleted reservoir zones from pressurized layers.
The authors have seen wells where this is the case, but they have also seen many where it is not. A rule of thumb is to check whether there is significant crossflow during the shut-in passes of the production-logging tool (PLT). With crossflow, choking back may not be a practical solution for reducing friction effects.
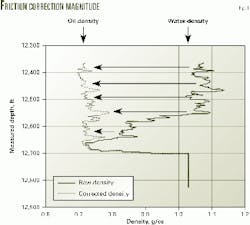
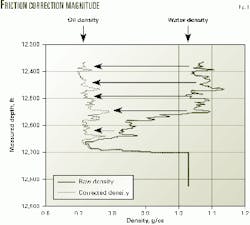
Fig. 1 shows the correction required for friction-affected logs in a UK North Sea oil well. This well is flowing at high rates through a 5-in. production liner, and the flow rate would have to be reduced to about 3,000 b/d from 10,000 b/d in order to eliminate most of the unwanted friction effect.
This particular well has a 0.3-g/cc density correction due to friction. This value is almost the difference between 100% oil and 100% water. Whatever correction approach is taken, one cannot be comfortable with such large corrections.
Many friction-affected density logs are being run in the world. Preventing excessive friction effects in future production-logging runs is fine, but there still are many existing differential-pressure density logs from high-rate wells that need to be corrected.
Of course, an operator can simply pay a service company to correct the friction affected differential-pressure density logs by applying proprietary methods. A service company may charge several thousand dollars per log per well to reprocess and correct friction-affected density logs.
It is, however, a relatively simple matter to derive a friction correction algorithm for a particular field. Doing so saves time and money and also helps develop in-house expertise.
Empirical approach
Development wells in a given field tend to be completed in a similar manner. For example, wells will have the same size and type of tubing, casing, liners, packers, etc. Standardized completions lower costs and simplify logistics because it is easier and less costly to submit one large order for tubing and completion equipment instead of separate orders for each well.
For a field with similar completions, the engineer can develop a correction algorithm for the fluid-mixture density measured with a differential-pressure tool. One important constraint in deriving such an algorithm is that all the wells should have low water cuts.
It is essential, therefore, to run production logs early in the well's life.
The empirical procedure is as follows:
- Collect all production log data available for the wells in the field. The logs need to be classified by the production logs according to the tool type and the same completion type. This classification step may be unnecessary if one service company carried out all the logging jobs in the field because probably in that case the same tool type would have been used on each job.
- Select wells with a low water cut. Low water cut wells are crucial because it is likely that the phase make-up of the fluid entering the production tubing, for example a small number of water droplets in a predominantly oil flow, is similar to the mixture measured in the test separator at surface.
The water holdup, therefore, seen by the differential-pressure density tool is about equal to the surface water cut. Note that this is a unique case in the life of a well because typically surface water cut is not the same as downhole water holdup. - Calculate water holdup downhole from surface water cut. One needs to assume the measured water cut at surface is equivalent to the water holdup at the tubing shoe depth. Then one can calculate the water holdup downhole using the PVT (pressure-volume-temperature) relationships for oil and water formation volume factors at the prevailing bottomhole temperature and pressure (see Equation 1 in the equations box).
- Estimate true fluid mixture density downhole from assumed water holdup. By knowing the downhole densities of oil and water, one can back out the true density of the fluid mixture from the assumed water holdup by either using surface measurements or shut-in log readings (Equation 2).
- Calculate the friction correction. The friction correction for the case investigated is the difference obtained by subtracting the surface-derived estimated fluid-mixture density (assumed to be the true density downhole) from the raw density log measured with the differential-pressure density tool (Equation 3).
- Develop a friction correction for varying downhole flow rate. By repeating the preceding procedure for every well with a low water cut, one has a data set with wells with slightly different flow rates. Hence, it is relatively straightforward to develop a friction correction for varying downhole flow rates.
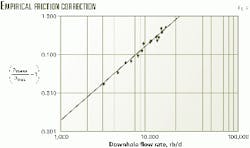
Fig. 2 shows the empirical plot obtained from fourteen low water cut wells. - Plot all data points available for the field in a suitable coordinate system. The coordinate system used in the friction correction plot (Fig. 2) is a form of the energy conservation equation, which will be discussed in detail in the concluding article of this three part series on production logging. In this friction correction plot, each point represent a log run in a well of the same field, at an early production stage with a very low water cut.
With this empirical approach, one does not need to calculate the friction factor either for the casing or for the tool. The empirical data points define a straight-line log-log relationship that takes into account the friction and geometrical parameters of the downhole environment.
One does not need to worry, therefore, about the real friction factor or the exact value of the tool and casing roughness. This is because the true fluid-mixture density has been calculated at one particular depth, such as the last data logged close to the tubing shoe.
It is impossible to compute a density at a deeper depth because its value cannot be known a priori, due to the water holdup phenomenon. Note that the empirical approach works only if one assumes that surface water cut is equal to water holdup.
Equation 4 best fits the data for the UK North Sea field in this study. In this equation the Qt is the downhole flow rate in reservoir barrels/day (rb/d). This empirical relationship is valid only for the wells in the field for which it was developed and for the tool, casing size, and well deviation considered in its derivation. The approach, however, can be used in any oil field.
- Calculate the true density depth by depth. After the empirical friction correction plot for the field is obtained, one can obtain the true density with the following three steps:
- Estimate the downhole flow rate from the spinner measurement.
- Obtain a value for (rmeas/rtrue) - 1 with the friction correction plot (Fig. 2).
- Solve for the true fluid-mixture density by using the raw differential-pressure density response from the log.
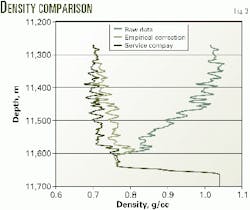
The friction correction obtained with this empirical method was applied to a friction affected differential-pressure density log in a high-rate UK North Sea oil well (Fig. 3). This analysis was done easily and inexpensively with a spreadsheet.
For comparison, the figure also shows the corresponding corrected density log from the service company.
Friction correction
As an example, consider the production log response of a UK North Sea well in which the spinner indicates a maximum total production rate of 8,000 rb/d of liquid at a given point in the production casing. The differential-pressure density tool gives a corresponding reading of 0.848 g/cc.
By applying Equation 4, one uses the empirical friction correction, derived for the field discussed previously, to decrease the 0.848 g/cc measured density to a 0.750-g/cc true density.
This difference between the measured and true fluid density due to friction effects is nearly 0.1 g/cc or almost 30% of the density span from 100% water to 100% oil.


