US M&A activity dips during third quarter
US oil and gas merger and acquisition activity fell sharply in the third quarter, but the trend is shifting toward asset sales and away from stock deals.
Mergers, acquisitions, and divestments (MA&D) disclosed in the first 9 months of 2000 reached a total of $31.8 billion in 289 transactions, according to Randall & Dewey Inc., Houston. The number of deals includes 87 transactions announced during the third quarter totaling $2.8 billion.
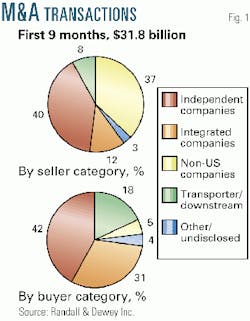
These were among the conclusions of the firm's quarterly analysis of selected US MA&D activity, based on transactions announced during the first 9 months of the year (Fig. 1).
"While the third quarter volume was less than 10% of first half volume," Randall & Dewey said, "the significance is in the increase in asset transactions, which accounted for 61% of total third quarter volume compared with 54% of second quarter volume."
"In a market so dominated by stock transactions," the firm continued, "active market participants are eagerly watching for an upturn in asset transactions as a signal that deal volume in the market-friendly size range of less than $100 million may also be on the rise."
During 1990-96, asset deals averaged $4.4 billion/year, Randall & Dewey reported, accounting for nearly three-quarters of the total annual deal volume. However, starting in 1998, "stock deals accounted for the bulk of MA&D activity, relegating asset transactions to about 10% of market share. For the first 9 months of 2000, asset transactions accounted for a significantly increased 24% of total transaction volume, reflecting the disposition of sizeable assets as megadeals closed and noncore assets were shed."
Deal statistics
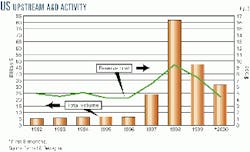
Randall & Dewey's assessment reports that the average deal cost for the transactions reporting both the value and volume of proved reserves involved was $4.70/boe for the first 9 months this year vs. $7.49/boe for the same period in 1999 (Fig. 2).
The firm said, however, that "the calculated reserve figures for 2000 continue to be dominated by the first quarter sales of long-life oil reserves in Alaska and in the Permian basin, offsetting higher calculated reserve values for stock transactions and the increase in asset transactions in the first 9 months."
According to the firm, starting in 1998, deals costing more than $100 million have, on average, accounted for about 93% of the transaction volume. Randall & Dewey said that, excluding the larger transactions that occurred each year during 1998-2000, "a more representative trend" has emerged in comparative reserve values.
"Without these larger transactions, the average acquisition cost for 1998, 1999, and the first 9 months of 2000 are $4.85/boe, $6.64/boe, and $5.71/boe, respectively. The significance of these numbers is the shift toward an average transaction value of $6.00/boe in recent months for larger transactions compared with an average closer to $5.00/boe for the lower volume years of the 1990s," Randall & Dewey noted.
The firm pointed out several "significant" transactions, all of which were announced during the third quarter:
- Forest Oil Corp. acquired Forcenergy Inc. for $630 million.
- Apache Corp. acquired Occidental Petroleum Ltd.'s Gulf of Mexico assets for $385 million.
- Chesapeake Energy Corp. acquired Gothic Energy Corp. for $325 million.
- PanCanadian Petroleum Ltd. acquired Montana Power Co. assets for $176 million.
- Evergreen Resources Inc. acquired KLT Gas Inc. assets for $176 million.
- Enterprise Oil PLC acquired R&B Falcon Corp. assets for $127 million.
- Phillips Petroleum Co. acquired River Gas Corp. assets for $123 million.
For the first 9 months, 29 transactions greater than $100 million accounted for $29.1 billion, or 92% of the total volume, the firm said.
Deal participants
When breaking the transactions down into industry segments by buyer and seller, Randall & Dewey reported that independent exploration and production companies were the most active participants in both categories during the first three quarters of 2000. This high level of activity, the firm said, reflected independents' "opportunistic portfolio-management activities." Based on net MA&D activity for the first 9 months of 2000, the independent segment accounted for $13.5 billion of the buyer activity and $12.6 billion of the seller activity.
The next most active participants in the seller category were non-US firms, which were net sellers overall, accounting for $11.6 billion of the seller activity and $1.6 billion of the buyer action. Meanwhile, the next most active buyers were integrated firms, which were net buyers, accounting for $9.7 billion of buyer activity and $3.7 billion in seller activity, said Randall & Dewey.
Randall & Dewey noted that the transporter-downstream segment accounted for a "significant" portion of the buyer activity with 18%, while comprising roughly 8% of the sellers. The segment added $5.7 billion in buyer action and $2.6 billion to the seller category. "With the continued possibilityellipseof gas demand putting pressure on gas supply," the firm said, "it will be interesting to see if the transporter-downstream segment increases its buyer activity in future quarters."
Continuing trends
Both the industry-wide consolidation of companies and the significant increase in oil and gas prices have played out as the "big stories" so far this year, said Randall & Dewey. "With oil futures prices reaching above $35/bbl and natural gas futures prices hitting a 10-year trading high above $5.50/MMbtu, both buyers and sellers puzzle over commodity price expectations and buyers ask, 'When will the asset transaction volume increase?'" the firm said.
"At midyear, it appeared that sellers were waiting until the second half of the year to bring better quality properties to market in an attempt to reap the full benefit of sharply higher commodity prices. As commodity prices increased during the year, few buyers were confident they knew the 'right price' to pay and many sellers were content to keep noncore properties a little longer than previously anticipated to strengthen financial performance."


