Modeling technique adds reservoir geometry to decline curves
A method that is consistent with the physical understanding of the reservoir can be used to project production rate as a function of time.
This method requires only some readily available information. Of course, more detailed field information should be included, whenever possible, to increase confidence in the model.
Incorporated in the model are some simplifying assumptions, and it has limitations, as does any mathematical representation. Judgment should be used in its application and the results need to be tested for reasonableness.
One needs to consider several unknowns in the process, and agreement between actual and calculated behavior is not necessarily a guarantee of a unique model.
Reservoir models
The mathematical reservoir modeling described in this article has evolved from the techniques described in References 1-3. The modeling concept is based on the relationships involving reservoir geometry, reservoir drive mechanism, and producing well productivity. Results can be readily obtained with a computer spreadsheet.
Reference 1 describes the simplifying assumptions and other conditions for mathematical model development.
As discussed in References 1 and 3, some equations, which apply to a wide range of cases, conform to well known decline equations. In addition, however, the technique described in this article has the advantage of offering a logical process for selecting the constants needed to apply the equations, using readily available reservoir behavior information.
In other words, the method does not rely solely on empirical comparisons of rate-vs.-time curves.
The concept has been used in various studies as a methodology for matching producing history and then projecting the results in time. When applicable, the technique described can provide fast, convenient results.
Basic equations
The following equations were derived in Reference 1for displacement-drive mechanisms in reservoirs with constant thickness, those that thin uniformly in the direction of displacement front movement, certain shapes with vertical-drive mechanisms, and solution-gas-drive reservoirs:
(1)
The rate-time relationship was given as:
Q ={1/[1+T(1-c)/c]}1/(1-c)= q/qi
In Equation 1, Q equals dimensionless flow rate equals q/qi, T equals dimensionless time (Equation 3), q equals reservoir production rate in stock-tank b/d (stb/day), and the c factor is defined by Equation 2. Subscript, i, is the quantity at the start of a decline period.
(1a)
As noted in Reference 3, the reciprocal form of Equation 1, corresponds to the conventional hyperbolic decline:
Q = [1+T(1-c)/c]-1/(1-c)
(2)
The factor, c, is defined as:
c = 1/(n+g)
In Equation 2, n is the productivity exponent and g is the geometric index. Note that in Equation 2 if productivity is constant, then n equals 0 and c becomes 1/g. Also, if g and n sum to 0, Equation 2 becomes undefined, and if these quantities sum to 1, Equation 1 becomes discontinuous.
In any case, where one of these problems occurs, it can be avoided by using values that sum higher or lower by very small amounts.
(3)
Dimensionless time is represented by:
T = 365tqi/NR
NR, recoverable oil, represents the volume recovered when the producing rate approaches zero and t equals time in years since start of decline period as described in Reference 1.
(4)
Cumulative production, or recovery, is given by:
R = 1-Qc=Np/NR
NP is cumulative production in stock tank barrels since decline started.
(5)
Productivity was defined as producing rate per unit of productive area. The factor, n, is an exponent that characterizes the relationship between productivity and recoverable oil as follows:
V =( 1-R)n = Q/A
In Equation 5, A equals dimensionless productive area equals a/ai, V equals dimensionless productivity equals v/vi, v equals productivity (stb/day/acre) equals q/a, and a equals reservoir productive area (acres).
Geometric index
This discussion introduces a new term, g, which is a geometric index that was derived, but not defined as such in Reference 1. It relates productive area with remaining recoverable oil, for the types of reservoir-drive geometry combinations mentioned previously, as follows:
(6)
A = (1-R)g
The exponent, g, was shown to have the following values:
- 0, when productive area is constant during depletion, as in the case of a thin oil column with vertical drive, or a solution gas drive.
- 0.5, for a frontal drive in a linear reservoir that thins at a constant rate. Subsequent analysis since the initial derivations has shown that this value also applies to a bottom-water drive in a spherical (dome) shaped reservoir.
- 0.667, for a frontal drive in a circular reservoir that thins at a constant rate.
- 1.0, for a frontal drive in a constant thickness reservoir.
Each of these g values is based on a certain physical description, and one will usually suffice to give a reasonable model.
Some situations have suggested that g could also have other values. It is possible that other geometric shapes occur in nature that are combinations of the listed conditions or other shapes that are not exactly represented by one of the classical conditions listed previously.
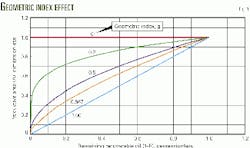
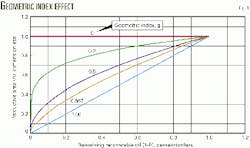
For various values of g, Fig. 1 illustrates the nature of the relationship between A and (1-R) as determined by Equation 6.
Dome-like shapes can be constructed, which do not conform precisely to any classical geometric shape, but whose properties reconcile to the shape of the curves in Fig. 1 and result in values of g that lie in the range of 0-0.5, assuming a bottom-water drive.
As discussed in Reference 1, certain cases of uniformly increasing reservoir thickness in the direction of frontal advance result in different forms for Equations 1 and 6. No specific reservoir configurations have yet been investigated that yield the relationship shown in Equation 6 with a value of g greater than 1.
Combining Equations 5 and 6 provides a means of solving for V if g is known, which is described as the Q/A method from Reference 1. Also, if well spacing is uniform, V equals current average well capacity divided by initial average well capacity. This procedure is referred to as the bbl/day/well method in Reference 1.
Example
In application of the concepts discussed above to analyze field history, the most readily available data are producing rates and producing well counts as a function of time. But it also would be useful to know the history of productive area-vs.-time, although these data are not always readily available. In addition, analytical determination of NR provides a valuable piece of information.
If these factors are known, n and g can be calculated directly from Equations 5 and 6. If production and well counts are the only data available, model construction requires a trial and error definition of the interrelated variables NR, g, and n.
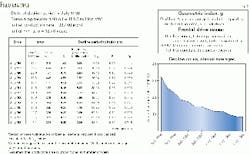
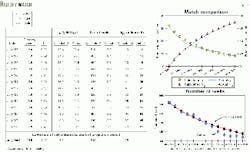
An oil field was selected for the following example from published information to illustrate the methodology. The calculations were carried out with a spreadsheet program. Fig. 2 shows the historical information used to set up the model and illustrates the historic production decline pattern.
Assuming that well spacing is reasonably uniform, productive area is approximately proportional to the number of producing wells. Under this assumption, A was estimated by dividing current number of wells by number of wells at the start of the decline period. NR was not known and was initially estimated as a volume about 10-12 times the initial annual production to provide a starting point.
With that, R could be calculated and the estimates of A were used to determine g using Equation 6.
As seen in Fig. 2, average g was calculated to be 0.71. A slightly better historic match can be obtained with this value of g, but since A was obtained by an approximation, the classical geometric index value of 0.667 was considered to be acceptable for the model.
Ideally, the relationship between A and (1 2R) and the resulting value of g would be determined with actual field observations.
Next, it was necessary to refine the estimate of NR, using the previously determined g. It would be useful to have specific knowledge concerning recoverable oil, but in this case a trial and error method was employed. A range of values of NR was tried.
Differences between calculated and observed producing rates and cumulative production were at a minimum with NR set at 151 million bbl at the beginning of the decline period. This procedure was made convenient by the use of a macro program within the spreadsheet to find the value of NR that would minimize the percent difference between calculated and observed q and Np.
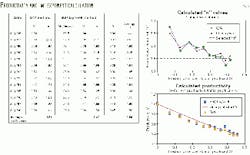
Fig. 3 illustrates the calculated values of n obtained by the Q/A method and the bbl/day/well method, as explained in Reference 1. As can be seen, when g equals 0.667, the n's obtained by the two methods are in good agreement. This indicates the values of NR and g are compatible.
For this model, a single average n, shown at the bottom of the right-hand column in tabular data, was selected as representative. This value is shown as a horizontal dashed line in the graph of the calculated n values.
Fig. 3 also includes a graph that measures the applicability of the selected n. This graph compares the calculated productivity, V, at each point and the V-vs.-R curve which resulted from the n values selected. Operating procedure changes can alter n and, in some cases, one may need to analyze behavior in separate time segments. In this case, however, the agreement is fairly good over the total period.
Shifts in productivity behavior should be taken into consideration in developing projections of producing rate. More specific field data provides a physical basis for changing trends, such as increased pressure maintenance, artificial lift improvements, etc.
Fig. 4 shows the calculated and actual producing rates and cumulative production. As shown, actual producing rates can vary over a wider range at specific points in time while cumulative production data tends to dampen these variations.
The trends of both sets of curves are in good agreement, suggesting a reasonable model has been constructed.
The comparison of actual and calculated number of producing wells vs. time assumes that well spacing is uniform and, thus, A calculated from Equation 6 is directly proportional to number of wells and vice versa. The degree of agreement between the two curves suggests that the assumption is acceptable.
Fig. 4 also provides an extension of the calculated producing rate column to the date of the first point in the projection process in Fig. 5. This value is useful in choosing the initial value of producing rate for the projection period if no change in operating practices is anticipated.
Projection in time
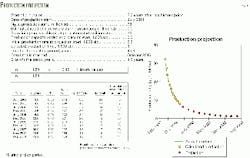
Fig. 5 projects the conditions defined in Figs. 2-4 until a selected producing rate limit is reached. Typically, this would be an economic limit based on local knowledge, but this example used an arbitrary oil rate limit of 1,000 stb/day.
Fig. 5 allows for a break between the last historical data point and the first point of the projection. It also allows the entry of an initial producing rate for the projection period and an additional recovery increment.
This permits the introduction of a build-up period if needed to account for modification of reservoir behavior, such as a drilling program, changes in pressure maintenance, improved artificial lift, etc. For comparison, projections can be made with and without planned programs.
If one expects significant changes in productivity, such as suggested by past trends, one can adjust the n for the projections accordingly. Also, if one anticipates variations in the reservoir geometry and productive area relationship, one can include another g value for the projection.
Fig. 5 uses a 3-year time step for the first projection and the initial rate has been selected to agree with the extension shown in Fig. 4. No additional recovery is assumed. The g and n values were the same as developed in the history match. Note the continued reduction in average individual well capacity implied by this n.
The result is a 45-year production projection. Cumulative production in the projection period is 41 million bbl, or 57% of the 73 million bbl recoverable estimate.
Greater recovery, over a longer period, would be reached by applying a lower production limit.
Any additional recovery program would require more detailed field knowledge. For example, if new wells were to be drilled over some time period, one could estimate the additional capacity and calculate the cumulative production during the drilling program from this information.
By starting the projection at the end of the drilling program using a new initial rate, qi, and remaining recoverable oil, NR, one can recalculate the rate projection and evaluate the benefits of the accelerated income. Expected additional recovery for such a situation also could be incorporated in the evaluation.
The modeling technique is also useful in developing a producing rate-vs.-time estimate in situations where no history exists, such as for new fields or potential development of exploration prospects. These evaluations require the estimation of an initial NR, production buildup during drilling, production rate during the plateau period, and plateau duration.
These values are often obtained by selecting the cumulative production, or fraction of NR, at which production is expected to equal total well capacity. A typical well model can aid in the selection. The procedure defines NR and qi at the start of the decline.
With this information and appropriate g and n estimates, one can apply the procedure outlined in Fig. 5 to determine the rate-vs.-time relationship for the decline period.
References
- Lohec, R.E., "Reservoir Geometry-1: Analytical approach evaluates frontal displacement mechanism," OGJ, Sept. 17, 1984, pp. 83-89.
- Lohec, R.E., "Reservoir Geometry-2: Analytical approach applied to known reservoirs," OGJ, Sept. 24, 1984, pp. 92-97.
- Lohec, R.E., "Relationship of constants clarifies decline equations," OGJ, Nov. 7, 1988, pp. 35-38.
The author
Ron E. Lohec has a consulting engineering business, Global Reservoir Engineering Inc., Houston. He specializes in reservoir management, planning, and economic studies. He previously worked for Exxon Production Research Co. Lohec has a BS in mechanical engineering from the University of Texas. He is a registered professional engineer in Texas and is a member of SPE.
