Data shows steep Prudhoe Bay production decline
Decline curve analysis illustrates the continuing steep decrease in oil production from the Prudhoe Bay field on Alaska's North Slope and suggests that the field may reach its economic limit earlier than other published analyses.
This study includes only the Sadlerochit sand, the main reservoir in the field, and it uses publicly available data from Alaska's Oil & Gas Conservation Commission (AOGCC) and Department of Natural Resources (DNR).
This analysis indicates a field-wide decline of 7-12%/year, the rate established since 1991. With a decline rate of 12%/year, the field's economic limit may be reached as early as 2010.
This compares with DNR's forecast of about a 4%/year decline.
History
Prudhoe Bay field has seen continual development since the early 1980s. BP Exploration (Alaska) Inc. (26.7%) recently became the single operator of the entire field. ExxonMobil Corp. (36.8%) and Phillips Petroleum Co. (36.5%) are other interest owners.
Producing wells have been drilled and completed continuously in the Sadlerochit at Prudhoe Bay since the opening of the Alaska Pipeline in 1977. By late 1979, the field reached Alaska's authorized producing rate of 1.5 million bo/d with 200 producing wells.
For the next 9 years, field production remained essentially unchanged but required a steadily increasing number of wells. In 1988, the final year the authorized rate could be maintained, 690 wells produced oil.
Well numbers continued to increase. From 1989-91, 855 wells produced oil, and during 1992-98, the producing well number varied between 835 and 870 (OGJ, Jan. 25, 1999, p. 76).
The leveling out of the number of wells, however, did not mean that new-well completions ceased. To the contrary, the rate of new completions increased during the 1990s. In 1991, 60 producing wells were completed, while 1994 through 1998 new completions varied between 66 and 79. For 1999, however, new completions slipped to 47.
Plugging and abandoning was the most common reason wells were taken off producing status. A small number also were converted either to injection or disposal status. New completions offset the number of older wells that were predominantly plugged and abandoned.
Field-wide waterflooding began in 1984 and miscible hydrocarbon injection was introduced in phases starting in the 1980s. Horizontal drilling started experimentally in 1986, and in the 1990s, became routine for lengthening wellbores and avoiding gas-oil or water-oil contacts.
Gas-handling-facility capacity was quadrupled with a series of expansions during 1988-92 and augmented again in 1999 to cope with increasing produced gas.
Against the background of intensified development, field-wide oil production reached the end of the plateau period in 1988 (Fig. 1). Except for 1991, oil production declined between 7 and 12% each year. Production in 1999 was about 35% of the plateau rate.
DNR's forecast oil-production rate of 309,000 b/d in 2010, which is consistent with recent reserve additions, would require the decline to flatten significantly to less than 4%/year (OGJ, Sept. 6, 1999, p. 38).
Ultimate oil recovery is estimated to be 13 billion bbl (OGJ, Jan. 25, 1999, p. 76). This would support a 300,000-bo/d production rate at yearend 2010, and still leave about 1 billion bbl in reserves to be recovered. The following decline analysis, however, indicates that the field will likely fall short of both DNR forecast rates and the estimated ultimate recovery.
Prolific wells
This study first analyzed the 42 most prolific wells. These are widely distributed throughout the field, covering about a 20 x 5-mile area, and are located on 18 of the 40 drilling pads in the field.
All these wells were completed early in the development, with 34 completed prior to completion of the Alaskan pipeline in June 1977. The other 8 were completed in 1978 and 1979.
Fig. 2 aggregates oil production from the 42 wells. In 1980, the wells accounted for 30% of the field's production and averaged 11,000 b/d/well. The cumulative production from these wells through 1999 approached 1.5 billion bbl, or about 15% of the oil recovered.
Production from the 42 wells peaked in 1980 and dropped 57% by 1984. The decline eased during the next 4 years, losing 20%, but steepened in the third 4-year period, losing 42%. Production in 1999 was 4.2% of the 1980 peak.
Only 22 of the 42 wells produced oil in 1999: Twelve wells had been plugged and abandoned, 7 were shut-in, and 1 was converted to a disposal well.
The 42 most prolific wells also show the difference between gas and water-drive wells. The gas-drive wells produce little or no water throughout their lives, while water-drive wells produce with water cuts of 50% at mid-life, eventually rising to 70-90% water cut.
In general, gas-drive wells produce with GORs 3-5 times higher than water-drive wells. Roughly 70% of the wells appear to be under a gas-drive. Among the 42 most prolific wells, 14 have a high-water-cut history.
Fig. 2 contrasts the profiles of the two groups.
Oil production from water-drive wells jumped 50% in 1985, concurrently with increasing water cut and evidently in response to field-wide waterflood operations begun in mid-1984 (OGJ, Apr. 18, 1983, p. 71).
Miscible hydrocarbon injection
Miscible hydrocarbon injection has been a major strategy for stemming the field's production decline (OGJ, Sept. 6, 1999, p. 38). The enhanced oil recovery (EOR) patterns started at various times between December 1982 and February 1987 and now cover about 86 sq miles, or more than half of the field's productive area (OGJ, Apr. 20, 1998, p. 64).
The first EOR project covered 6 sq miles along the southern limit of the productive Sadlerochit sand (OGJ, Dec. 6, 1982, p. 118). Annual production from this area provides a glimpse into the future as to what can be expected from subsequent miscible projects.
The first wells were drilled in the area in 1979. Before the end of 1982, and before the start of miscible injection, 28 wells had been completed and placed on production.
An additional 22 wells were completed by June 1983, after miscible injection began. All 22 wells were placed on production during 1983 and 1984. Oil production from the secondary wells would be influenced by miscible injection from the beginning of their histories. The first injection phase began in December 1982. Other phases were added throughout 1983.
The first phase of field-wide waterflooding began in mid-1984. This project brought conventional pressure maintenance to the portion of the reservoir containing the EOR project.
No wells were completed in the project area between June 1983 and February 1992. Twelve wells were completed and placed on production between 1992 and 1998. Of these 12 wells, 9 were sidetracks from original wellbores.
Fig. 3 shows the oil production for the three groups of wells.
Only 7 wells produced oil in 1979, 12 wells in 1980, and the same 12 wells in 1981. Production slipped slightly in 1982, the final year without miscible injection, although producing wells in the project area had increased to 27. In 1983, miscible gas injection was phased in, with 38 wells on production, but oil production was still decreasing.
The next 2 years brought a turnaround. In 1985, oil production was 2.5 times that of 1983-46 wells produced in 1984 and 47 in 1985. Per-well productivity had doubled. The surge in production was likely due to a combination of three effects:
- Mixing the remaining oil in the pore space with the injected gas to create a miscible phase, which is more mobile within the reservoir.
- Injecting water to mobilize the miscible phase toward a wellbore.
- Maintaining reservoir pressure by both water and gas injection.
The dominant oil production peak during 1984-89, however, consisted primarily of conventional reserves. This distinction was shown in a 1988 enhanced-oil-recovery (EOR) survey that reported 50,000 bo/d total production and 5,000 bo/d enhanced production (OGJ, Apr. 18, 1988, p. 56).
EOR continued to contribute a small fraction of total production from the initial project area, about 20% in 1994, the last EOR survey to list the project separately (OGJ, Sept. 26, 1994, p. 72).
The foregoing observations indicate that reserves produced by EOR methods are small in comparison to production by conventional methods. Furthermore, production from EOR is spread over many years and contributes only a small fraction of total production until late in reservoir life.
Extrapolating this conclusion to 2001 to 2005, one could expect the ratio of EOR to total production to climb to 50%, but total production will likely continue its slide.
Initial 28 wells
Fig. 3 tracks the production history for the first 28 wells completed. All these wells began producing by 1982 and are the only wells to have produced under natural reservoir pressure, then later under miscible injection and waterflooding.
The production profile clearly distinguishes between the two production methods. Production under natural reservoir pressure peaked in 1981-82 and dropped nearly 40% in 1983, as the area was prepared for miscible injection. The combination of miscible injection and waterflooding gave the reservoir a major boost, as indicated by a 220% increase in production from the 28 original wells during 1983-86. The peak in 1986 was 32% higher than the 1981 peak under natural reservoir energy.
The production profile shows a division between primary reserves produced under natural reservoir energy and secondary production through pressure maintenance. Primary production is clearly less, having dropped sharply after 1982.
The project area without gas and water injection possibly would have closely tracked the decline curve of the initial 28 wells during 1992-99. Secondary production would then be enclosed between the extended curve of primary production, from 1983, and the actual production profile of the 28 wells after 1983 (Fig. 4).
EOR production would start in 1988 as a narrow slice of the secondary volume, gradually widening in the 1990s.
1990 wells
No wells were completed in the project area from June 1983 until February 1992, but 12 were completed and produced oil before yearend 1999. Production profile of these wells (Fig. 3) illustrates that their cumulative production is a small fraction of that from either the 28 original wells or the 22 infill wells of 1983.
In fact, cumulative production from these 12 wells is barely 7% that of the original 28 wells.
The production profile is also notable for its lack of growth. The sharp contrast in performance of old-vs.-new wells illustrates that infill drilling in the project area is reaching diminishing returns.
The production histories of the 12 wells indicate steadily deteriorating production. After producing at maximum rates during the first few months, each well shows consistent, month-to-month, decreased oil rate and increased water cut.
Wells completed in the mid-1990s typically began producing 2,000-3,000 b/d (a few wells at considerably higher rates) but fell to 300-1,000 b/d by the end of 1999. All wells, except one, had water cuts of 70% to more than 90% by 1999.
More importantly, the newest wells, completed in 1997 or 1998, exhibited more-rapid decline in oil rates and increased water cuts than wells completed in 1992 or 1993, as follows:
- Well 14-05A was the first well to be completed in the 1990s. It produced 2,400-2,500 b/d during 1992. Oil rates slipped to less than 1,000 b/d by yearend 1993 but remained in the 500-1,000 b/d range until mid-1997. On-stream time was cut to 50% for several months, then shut-in for 14 months.
Full-time operation resumed in May 1999 but averaged less than 200 b/d for the rest of the year, with water cut near 95%.
- Well 13-08A was the latest well, completed in Dec. 22, 1998, it produced 1,450 b/d in January 1999 but only 625 b/d in February. Oil rates were below 400 b/d for the rest of the year, with water cut exceeding 80%.
- Well, 14-08A, a prolific producer, completed in Oct. 15, 1998, was the seventh best producer for the entire field in 1999, but oil rates dropped by a factor of 5 over the course of 1999. It produced 8,200 b/d during its first 14 days in October 1998 but fell each month, reaching 1,000 b/d by October 1999, while water cut rose from 6 to 73%.
- Well 12-34, completed Mar. 7, 1995, had a maximum 1,400 bo/d oil rate in July 1995, with a 20% water cut. Water encroachment resulted in a water cut greater than 80% in mid-1996. Mid-1999 producing rates were 250 bo/d, with water cut greater than 90%.
- Well 12-35, completed Oct. 27, 1995, had a maximum 4,800-4,900 bo/d producing rate in November and December 1995. But by mid-1996 production was 1,200-1,300 bo/d with 50% water cut. In mid-1999, it produced 250 bo/d with 85% water cut.
- Well 13-36, completed Dec. 24, 1995, had a maximum 2,630 bo/d rate in January 1996. By mid-1997, it produced 300 bo/d and in September 1999 production was 167 bo/d with 70% water cut.
Observations
Fig. 3 indicates that the first EOR project at Prudhoe Bay appears to have nearly completed its productive life. Most of the cumulative production occurred in the first 10 years of miscible injection (1983-92), during which the field operator attributed only a slim increment of production to EOR.
The first EOR project is unique, however, in that miscible injection began while the reservoir produced under primary conditions. During its first 10 years, miscible injection maintained reservoir pressure and enhanced oil rates, thus accelerating recovery within this project area.
By mid-1990, after most of the flush reserves were produced, miscible injection began contributing a greater fraction of overall production, but at well producing rates far below primary rates.
This first EOR project illustrates the production that might be expected over the next 10 years.
Field operators have cited selective infill drilling as a method to slow production decline (OGJ, June 24, 1996, p. 56). This likely contributed to stabilized production during 1997-99 (Fig. 3). Rapidly declining productivity of new wells, however, suggests that even the most methodical technologies for selecting new drill sites may not sustain production over the long term. Production from the 12 later wells contributed a substantial 39% of total production in 1999, but the wells produce erratically and at low rates (Fig. 3).
Production histories indicated that oil-producing rates decline so fast that new wells barely make up the difference. The slight increase in production from 1998 to 1999 is due entirely to the prolific production of one well, 14-08A. But its production declined 80% in 1999, insuring that production from the 12 later wells will be lower in 2000.
Prospects for new completions in 2000 are not good. One well, a dual-lateral, was permitted in late 1998 but was not completed as of yearend 1999. No other permits are pending in the project area.
The best producing wells, in 1999, may indicate future productivity in the project area. In 1999, 41 wells produced oil, but 11 produced 55% of it (Table 1).
Table 1 suggests that future production rates will be affected more by older wells than by recent wells. Eight of the 11 most productive wells in 1999 were 1983 completions, while the other three were 1998 completions.
Wells completed by 1983 declined more slowly during the late 1990s than wells completed in the 1990s. During the late 1990s, Wells 13-34 and 14-29, completed in 1982, show the highest and most consistent oil rates, with the lowest water cuts. On the other hand, Wells 14-08A and 13-08A, 1998 wells, declined rapidly to become average producers in 2000.
The only 1998 well to indicate sustainable production is l3-02B, a dual-lateral well. No other well in Table 1 shows signs of sustainable production beyond 1999. Water cuts exceeding 90% prevail and climb. Other wells in the project area produce at similarly high water cut.
Well histories lead to the unavoidable conclusion that the project area is nearly depleted of producible oil. By 1999, most wells produced less than 500 bo/d, with 90% water cut and on-stream time declining. An occasional new well, such as Well 14-08A, has produced a few thousand bo/d for a few months, but rates have dropped quickly, approaching within 1 or 2 years the production characterized by older wells. Production from the project area will, therefore, continue to decrease as old wells decline and new well production is insufficient to offset the decline.
New miscible injection patterns are unlikely to show even a brief increase in production, since most secondary reserves would have been previously produced under waterflooding and other pressure-maintenance methods.
Horizontal wells
JX-02, completed in November 1985, was Prudhoe Bay's first horizontal well. Its horizontal section penetrated 1,615 ft of a 220-ft thick Sadlerochit sand. The well was reported to have produced for about 60 days at a sustained rate of about 12,400 bo/d, compared with about 3,000 bo/d for a conventional vertical well in the same area (OGJ, Feb. 17, 1986, p. 42).
The production records of JX-02, however, show that it produced 4,460 and 3,770 bo/d during its first 2 months of operation. Its most prolific month was 7,763 bo/d, 3 months after being completed. Its most prolific year was 1986 when it averaged 4,000-5,000 bo/d.
During l987, the well averaged 3,000-4,000 bo/d most months but slipped to 2,000 bo/d in the final 3 months.
Production from JX-02 declined gradually during 1988-93. In 1989, it averaged 1,350 bo/d, with 3,500 scf/bbl GOR, slightly above the field average. In 1993, the rate was 700 bo/d; with a 10,000 scf/bbl GOR, about twice the field average.
JX-02 was on production only 50% of the time in 1994 and did not produce after January 1995.
JX-02 produced a cumulative 5 million bbl of oil, ranking it slightly below the median of its contemporary wells in the field. Its life was considerably shorter than its contemporary wells, but it produced at higher than average rates during its early years.
Other horizontal wells
By yearend 1989, 19 horizontal wells were producing in the field. Refinements such as "inverted" wellbores, which are laterals greater than 90°, increased the distance between the lateral and the water-oil contact. Pay length in the 19 wells ranged from 390 to 2,160 ft; with 12 wells having lengths greater than 1,000 ft (OGJ, Feb. 26, 1990, p. 53).
The first 19 horizontal wells were distributed almost evenly across the field's productive area, with a slight bias toward the western half. The 19 wells were drilled from nine drilling pads, with no more than 3 wells on a pad. Fourteen wells were spread throughout the western half of the field, with 5 wells in the eastern half.
Production from the 19 wells (Fig. 5) peaked sharply in 1988 and then fell by 50% during the next 4 years despite flush production from 5 wells completed in 1989. Production stabilized in 1993 and 1994, then fell 15%/year through 1999 to 12% of the 1988 peak.
Production comparison
Horizontal well effectiveness can be judged by comparing their production histories with contemporary conventional wells. A comparison group of 19 wells was selected to match as closely as possible each horizontal well by bottomhole location and completion date.
For example, three horizontal wells were drilled from Pad G with completion dates between September 1986 and January 1987, while three conventional wells were also drilled from Pad G between August 1986 and December 1986.
Fig. 4 shows the production from 19 horizontal and 19 vertical wells. Both profiles are similar. Cumulative oil production through 1999 for the 19 horizontal wells is 4.5% greater than for the 19 vertical wells, 99.22 vs. 94.96 million bbl.
Profile shape shows only minor differences, with the horizontal group's production peaking 2 years earlier and being 12% greater. Both group's declines tracked closely, and both had stabilized production rates during 1992-94, indicating that other field operations affected both in similar ways.
The conventional group wells have longer producing lives and their decline rate lessened noticeably after 1995, while the horizontal well production decline continued unabated.
In 1999, the conventional group produced nearly twice the oil as the horizontal group, a gap that will likely widen in the future. At yearend 1999, 14 of the 19 conventional wells were still producing, compared to only 8 in the horizontal group.
Moreover, three of the eight remaining horizontal wells may be nearing the end of their productive lives. These three wells show GORs nearly twice the field average, while time onstream is only 15%.
During the late 1990s, conventional-well production appears more stable, and therefore cumulative oil production from these wells may eventually be the same as for the horizontal wells.
Declining productivity
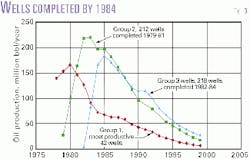
Fig. 6 shows production profiles representing about 80% of all producing wells completed during 1979-84 and the profile for the 42 most prolific wells.
In Group 1 are the 42 most prolific wells of which 34 were completed before 1978, and the other three by 1979. Group 2 has 212 producing wells completed during 1979 through 1981. Group 3, has 218 producing wells completed during 1982 through 1984, and the final Group consists of the wells drilled in the 1990s.
Group 1
The production history of Group 1 was previously described in detail. After declining to less than half of their peak rate in 4 years, the decline rate of these wells lessened noticeably during 1984-88, probably due to the beginning of the field-wide waterflood during 1984-85.
After 1988, the decline resumed through 1999, during which the group produced at 4% of its peak rate. The decline indicates that the bulk of incremental reserves attributed to waterflooding was produced during the first 8 years of operations.
Group 2
Group 2 wells were selected randomly to include as many wells as possible that were completed during 1979-81. Group 2 produced about twice the cumulative oil as Group 1 but required five times more wells. Almost all Group 2 wells were completed after the Group 1 wells; therefore, they produced after the flush production period.
After a 2-year peak rate in 1982-83, Group 2 production declined by about 10% in 1984, before remaining constant in 1985, probably due to the waterflood.
Production declined about 10%/year during 1986-90, then abated slightly in 1991-92. The brief reduction in decline may be attributed to the expansion of miscible injection throughout the field during 1985-90. Enhanced productivity, during this period, also was observed in the first horizontal wells.
After 1992, the decline followed a gradually tapering curve. Production in 1999 was 8.3% of the peak rate in 1983. By 1999, 34 of the original 212 wells had been converted to gas or water injection, and 67 had been plugged and abandoned.
A few Group 2 wells produced a disproportionate amount during the late 1990s. Of the 111 Group 2 wells producing oil in 1999, 23 wells produced 53% of it, indicating that productivity is highly variable throughout the field.
Well 07-09 is the most productive Group 2 well in 1999, averaging 2,900 bo/d. It produced about 58% more oil than the next most productive well in Group 2 and was the second most productive well in the field. But its production appears to be short-lived.
Completed in 1979, it consistently produced 6,000-8,000 bo/d until 1984, even averaging 9,130 bo/d in February 1984. After a gradual decline, it produced 4,000 bo/d in May 1988. Then its productivity dropped to 1,000-1,500 bo/d with occasional shut-in periods.
During the mid-1990s, production fluctuated, never exceeding 2,500 bo/d. From May 1997 through September 1998, it was on-line only 118 days, averaging 1,500 bo/stream day. During 3 months, it was shut-in.
But probably because of a workover, Well 07-09 averaged 3,000-3,700 b/d during the next 13 months while being on-line every day.
The production histories of the closest wells surrounding Well 07-09, however, suggest that resurgent production will be brief. Wells to the north, east, and south, about 0.3-0.5 mile from the well, produced between 15-30% as much oil in 1999 as did Well 07-09.
Two other nearby wells have been plugged and abandoned. Only one well near Well 07-09 is highly productive. It is 0.3 mile to its west and in 1999 produced at a rate of about 68% of Well 07-09.
Group 3
The profiles of Groups 2 and 3 wells are remarkably similar. Group 2 has roughly 30% more cumulative production than Group 3 and a 16% greater peak production rate. In 1999, Group 3 wells produced 14.6% of their peak production.
Field-wide waterflooding occurred as production from Group 3 wells peaked. The decline curve, therefore, was not visibly affected. The bulge in the decline curve during 1989-92, however, is probably the result of miscible injection. Similar bulges were noted in the early horizontal wells, and the group of comparison wells (Fig. 4), and in the first EOR project (Fig. 3).
The Group 3 bulge during l989-92 illustrates again that the effect of miscible EOR is realized relatively early in the project. Moreover, the effect on a large number of wells randomly distributed throughout the field, such as Group 3, is a slight flattening of the decline curve for a few years, followed by exponential decline.
The benefit of miscible injection extends many years beyond the visible bulge by raising the entire decline curve, extending field life, but at relatively low and decreasing production rates.
Wells drilled in 1990s
Wells completed during the 1990s were grouped by completion date, with each group consisting of all wells completed during individual years.
Fig. 7 shows annual oil production for wells completed during 1991 and 1994-98. A single point represents 1999 production. The number of wells completed in each of these years are 60, 66, 66, 79, 75, 71, and 47, respectively.
Peak annual production for each group occurred 1 year after the wells were completed. For example, production from wells completed in 1996 peaked in 1997.
Annual production decreased every year following the peak year. The steady decline contrasts with earlier wells that were affected by responses from waterflooding and miscible injection.
Production profiles in Fig. 7 show that wells completed during 1991 and 1994-96 collectively held a consistent production level. Each successive year of new completions produced at levels high enough to offset declining production from earlier wells.
For example, first-year and peak-year production for each group varied within a narrow range without showing a discernable trend. The 1996 group had the highest production for both years, including both the first and second years following the peak year for each group.
A downward trend began to emerge in 1997. Although the number of wells completed in 1997 (75) was almost unchanged from the 79 in 1996, oil production from 1997 wells was substantially less than from 1996 wells.
A comparison of all 3 years of equal age shows that first-year and peak-year production dropped by 27% and 26%, respectively. Third-year production dropped by 33%.
Production from the 71 wells of 1998 continued to slip relative to 1997 wells. First-year production declined by 15%, and peak-year by 12%.
The trend accelerated in 1999. First-year production from the 47 wells completed in 1999 was 48% lower than first-year production from 1998 wells.
The new trend of progressively lower oil production from completions after 1996 was clearly established by yearend 1999 and could not be confirmed until production data from wells completed in 1998 become known, but the trend was clearly established.
Production histories of wells completed during 1997-99 suggests that the decline in completions may be due to fewer potentially productive drill sites. While new completions dropped from 71 to 47 between 1998 and 1999, the number of unsuccessful wells was 10 for both years.
An unsuccessful well stands out with extremely low oil producing rates and long periods of downtime. It typically produces less than 60,000 bbl of oil during the first 18 months.
The success ratio for 1998 wells was 61 out of 71 completions but fell to 37 out of 47 in 1999. Applying the same standard to the 75 wells completed in 1997, only 3 wells were unsuccessful.
Early indications point to fewer completions in 2000, perhaps no more than 40. During the early months of 2000, new completions and drilling permits were fewer than for the same period in 1999.
With declining productivity in the late 1990s, field-wide production in a few years might actually decline faster than the rate of 7-12%/year established since 1991, unless the decline rate of older wells can be reduced.
The production profile of wells completed during 1994 through 1999 (Fig. 8) also illustrates the declining productivity of recent infill wells. For example, production for 1995 is the same as the oil produced in 1995 from all wells completed during 1994 and 1995. Likewise, production for 1997 came from all wells completed during 1994-97.
Production from each group of new wells exceeded the decline in production from earlier wells. As a result, production from all wells completed after 1993 increased each year until 1998.
Then the trend reversed. In 1999, new production from wells completed in 1999, plus increased production from wells completed in 1998, was 5.6 million bbl less than the total decline during 1998-99 of wells completed during 1994-97.
Fig. 8 illustrates that new wells of the 1990s have been able to sustain oil production only within the population of wells completed during the most recent 5 years. Because all other wells in the field have declined during the 1990s, total field production has declined steadily.
Future potential
Miscible EOR injection continues to be extended throughout the reservoir. EOR is extended to patterns according to available miscible injectant from the gas processing facilities. The most efficient patterns receive the most injectant.
The most recent addition to the gas facilities began operating in October 1999. This consisted of a 2,700-ton, gas-compression module, capable of increasing miscible injectant by 20%, and field-wide gas-handling capacity by 14%. The increased capacity enhances both gas-cap expansion and miscible injection. This module is expected to increase ultimate liquid recovery 50 million bbl (OGJ, Sept. 6, 1999, p. 38).
Improved field-wide procuction is noticible with a 4% decline from January to August 2000, compared to 1999. But the reduced decline rate will be realized for only 1 year. The module is merely removing a gas-compression bottleneck.
Since 1988, the field has restricted oil production rates because of limited separation and recompression facilities for produced gas that is injected either into the gas cap or the oil zone (OGJ, July 11, 1988, p. 30).
Operators carried out a staged increase in capacity of gas-handling facilities during 1988-92 in response to steadily increasing field-wide GOR. Oil rates were thus determined by the rate at which gas could be separated and re-injected into the reservoir. During warm months, gas-compression capacity had been 25-30% less than during cold months because compressors must operate in a higher ambient temperatures.
With the new compressor module, however, field-wide rates of gas production appear to have peaked in December 1999, only 1% higher than the previous winter without the new module. Oil rates in the winter, therefore, were not restricted. The restriction lasted from April through September.
During the summer of 2000, field-wide oil production will have to be reduced only slightly from winter rates, compared to previous years. This will result in a smaller decline in field-wide production from 1999 to 2000. Whereas production declined 12% between 1998 and 1999, the debottlenecking effect of the new compressor might reduce the next annual decline to only 6-7%.
The improved summer production rate relative to winter will be realized only in 2000. Without another major equipment installation to mask declining production, the rate of decline observed during most of the 1990s (9-12%/year) will resume in 200l.
Forecast to 2010
All evidence points to continuation of the established decline. To that end, two decline curves are calculated to project production rates to 2010: 7-9%/year low side and 12%/year high side. These decline curves bracket the range of production rates that can be expected from the continuation of aggressive operations.
Operations to maximize production would include waterflooding, miscible injection, and infill drilling to the extent that potential drill sites can be identified.
Fig. 1 shows the two calculated decline curves, along with the forecast by the Alaska's DNR. The calculated curve at the low decline rate yields a production rate of 203,000 b/d in 2010.
Ultimate oil recovery would be 11.8 billion bbl, with an estimated field life to 2018. The high decline-rate forecasts a production rate of 136,000 bo/d in 2010, with 11.4 billion bbl ultimate recovery and a field life to 2012.
By contrast, the Alaska DNR forecast the production rate in 2010 to be 309,000 bo/d. Field life would extend beyond 2020, with 13 billion bbl ultimately being recovered. Cumulative oil production reached 10 billion bbl in May, 2000.
For DNR's forecast to be realized, the field-wide decline rate would have to be reduced, and soon. The forecast also requires:
- Old well oil production rates to stabilize.
- New well production rate declines to be stemmed.
- New wells to be as productive as the older wells.
- These improvements need to have started by yearend 2000 and be field wide in 2001.
References
- "Prudhoe Bay Miscible Gas," BP, videotape.
- McGuire, P.L., et al., "Unconventional Miscible EOR Experience at Prudhoe Bay, SPE Paper No. 3962B, 1998.
The author-

Tomas H. Standing has worked in civil and chemical engineering and most recently in pipeline maintenance for the San Francisco Public Utilities Commission. For the past 15 years, he has also studied trends in production and development of US oil resources from publicly available data. Standing has a BS in chemical engineering from the University of Minnesota and is a registered civil engineer in California.