Gas-detection technology defines oil-gas-water contacts
Mudlogging technology-1
Differential total gas (DTG), a mudlogging technology that uses dual gas detectors to compare response profiles, can quantitatively measure heavy hydrocarbons (C3-C5) in the gas stream, allowing wellsite personnel to distinguish between gas, oil, and water contacts.
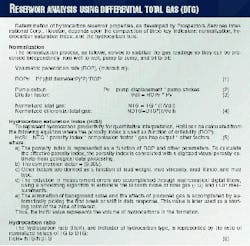
Reservoir evaluation using this patented technology involves the normalization of raw DTG and other real-time drilling data (penetration rates, fluid properties), leading to the computation of a hydrocarbon saturation index and hydrocarbon ratio.
Whereas data normalization accounts for the amount of rock drilled, variations in the volume of mud dilution, and the gas-carrying properties of the drilling mud, the hydrocarbon saturation index and hydrocarbon ratio provide graphical insights into reservoir characterization from well to well (see box), independent of reservoir rock type.
Supplementing the gas-detection technology, an improved gas-trap design, driven by an internal turbine, provides a purer, undiluted sample stream more representative of the produced gases.
These technologies, which have been used on more than 200 wells in North America, Sudan, Kazakhstan, and Russia, have been used by several companies including Mobil Oil Canada, Calgary; Meridian Resources Corp., Houston; and Black Sea Co., Tyumen. Currently, 15 units are operating in Canada.
This first of a three-part series discusses the above technologies, the second describes new sample evaluation techniques, and the conclusion shows methods for measuring coalbed methane content.
Systems
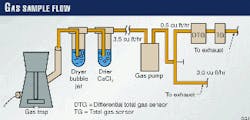
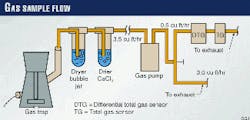
The hardware for DTG consists of two gas-detection sensors, a gas-sample pump, flow regulators, and a central processing unit. With DTG, the first sensor measures the conventional value of total gas (TG).
At the same time, the second sensor (DTG) measures the value of heavy components in the gas-sample mixture. In this case, the DTG zero is set to reflect the normal proportions of C1 + C2 in natural gas, in turn providing a basis for gas characterization.
Sensor setup
Leading up to the gas detectors (Fig. 1), mounted within a mobile laboratory, the gas stream flows at 3.5 cu ft/hr through a 3/8-in. ID sample line. Once the gas enters the laboratory, part of the gas is exhausted, while the remainder flows continuously at a rate of 0.5 cu ft/hr.
The sensors, set up in series, include a conventional thermal conductivity sensor, capable of providing gas mixtures ranging from 0 to 100%, and a differential sensor that uses a thermal-electrochemical mechanism to detect heavy gases.
Response
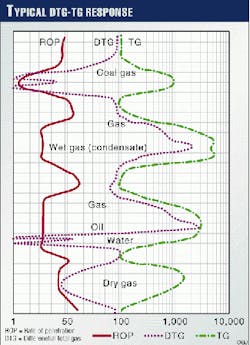
For interpretive purposes, a deficit of C2 shows a negative DTG value while positive values indicate the presence of C2+, C3+, C4+, or C5. Propane (C3) and butane (C4) gases produce higher DTG deflections than shown with TG sensors.
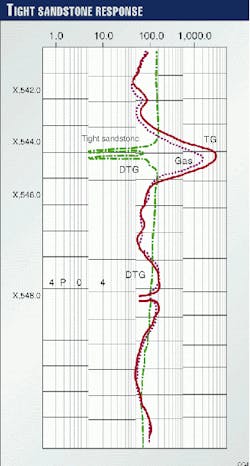
Fig. 2 shows the typical response of TG and DTG deflections in the gas mixture where the TG-DTG ratio is used for characterization.
Additional responses are as follows:
- Coal-gas response: DTG deflects to the left while TG deflects to the right.
- Natural gas response: DTG deflects slightly to the right while TG deflects strongly to the right. This creates a TG-DTG ratio between 5 and 8.
- Condensate or wet-gas response: DTG may initially deflect to the left and later move back to the right. This dynamic response has been noted in carbonate sections. Typically, DTG deflects to the right while TG significantly deflects to the right, creating a TG-DTG ratio in the range of 3-5.
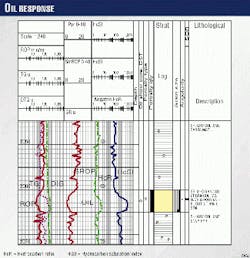
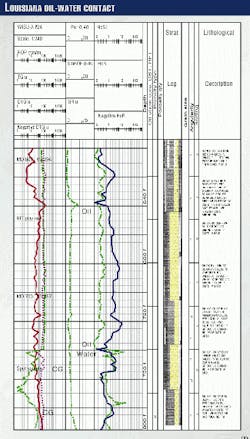
- Oil-type gas response: DTG and TG both deflect to the right creating a TG-DTG ratio of less than 3. In some tight reservoir rocks, however, the upper zone may act like a gas. Fig. 3 shows a real time printout of an oil-water contact response.
- Bituminus shale response: DTG and TG both deflect to the right creating a TG-DTG ratio of less than 2. The magnitude of the deflection usually is in the range of a few hundred units.
- Tight, very-fine sandstone and siltstone response: DTG deflects to the left while TG deflects to he right. Fig. 4 shows a real-time printout of dry gas in sandstone.
DTG vs. chromatography
Because the DTG system design and interpretation process is substantially different than conventional gas-detection technologies, it is important to compare the advantages of some of the former with the drawbacks of the latter.
Volumetric sampling
To separate discrete gas components, chromatography uses a column that is periodically filled with gas. Because the sample volume can be 1,000 times less than the total volume of the produced gas stream, however, the possibility of error becomes large, resulting from an uneven distribution of heavy and light gases in the sample.
Additionally, the small-diameter sample loop, which leads up to the gas-chromatography column, provides nonlinear sample flow as heavier hydrocarbons and moisture encounter the frictional effects of the tube wall.
On the other hand, the DTG gas detector, supported by a continuous low output-input ratio from the turbo gas trap, uses a relatively large sample size resulting in unmeasured volumes only three times that of the measured volume.
And because no carrier gas is used (Fig. 4), the flow in the DTG sample loop becomes slow and laminar. This preserves the original distribution of heavies in the sample loop that help reduces sampling error.
Osmosis devices
With all other parameters equal, the number of heavy molecules that penetrate a conventional osmosis or permeation device in time is significantly less than the number of small molecules (C1).
Thus, even in a heavy gas show, the sample arriving at the analyzer will contain mostly methane.
Furthermore, dilution in conventional gas chromatography, or the addition of air into the gas-sample stream, is an often-used practice in gas chromatography. Yet, because the combustion process consumes oxygen, the process is limited to about 6-10% concentration of hydrocarbons in the sample flow.
And because dilution is used to increase the range of measurable concentrations and mixtures of hydrocarbons, it introduces a major error in field measurements.
Towards the end of the gas measuring system, the permeation devices use the same catalytic sensors. Thus, there is a nonlinear reaction of hydrocarbon combustion in the sensor chamber due to C1-C5 molecular sizes.
Turbo gas trap
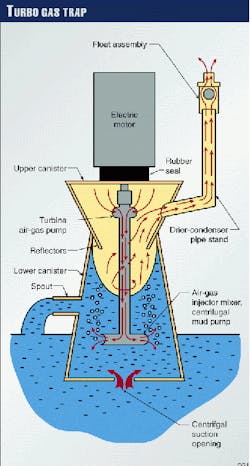
The patented turbo gas trap (Fig. 5), which samples gas liberated from the drill fluid at the end of the flowline, improves upon the design of the conventional gas trap or T-bar shaped beater. The driving mechanism involves three interacting steps.
First, the turbo gas trap sucks the gas-air sample mixture from the upper chamber of the gas trap. Next, it pushes this mixture, under pressure, through a T-shaped hollow injector-mixer positioned inside the bottom chamber of the trap. Finally, the gas-air sample is injected into the mud line, a result of turbulent flow initiated at the tip of the injector.
This turbulence creates a pressure drop that increases the pressure differential, resulting in the formation of gas bubbles. The formation of these bubbles provides a dual effect on the gas-collection system.
First, they decrease the weight and viscosity of the drilling fluid, allowing the sampled gas to be easily pumped while making the system less sensitive to mud level fluctuations. The floating-lifting effect, as caused by the mud-weight differential, also improves turbo performance.
Second, under the basic properties of fluid flow and gas diffusion, the molecular pressure and concentration of the gas in the bubble and the solution are equalized instantly within the trap. This allows the gas trap to liberate continuously a comprehensive gas sample.
Thus, by reinjecting the gas-air mixture into the sample loop, the new design increases the liberation of gas from the mud by close to 100% while allowing stable gas samples to be carried by the mud. A second exhaust spout also helps to eliminate the problem of fluctuating mud levels (Fig. 6).
Louisiana case study
Providing an example of these gas detection technologies, geologists used the DTG technology to define several zones of interest in a well located in Wise field, south Louisiana. The first zone drilled through a salt section to X,284 ft, encountering oil-filled fractures that indicated a strong possibility of producible quantities from the hydrocarbon saturation index.
The hydrocarbon ratio additionally indicated the presence of oil.
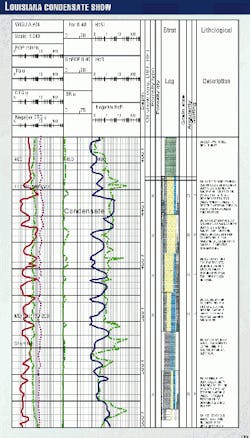
Next, the well encountered a condensate show in a fine-grained, moderately sorted sandstone from X,420 to X,450 ft (Fig. 7a), indicating fair to good porosity ranging from 12% to 20%, as shown by the rate of penetration and visual observation of the samples.
The hydrocarbon saturation index curve, positioned in the end of second cycle of logarithmic scale, indicated a fair hydrocarbon show. The hydrocarbon ratio curve, additionally, which ranged from 3 to 4, showed indications of condensates.
The third show, from X,450 to X,530 ft, also consisted of sandstones similar to those above. The hydrocarbon saturation index curve, however, remained within the lower values of the second cycle, indicating a poor hydrocarbon show.
Yet like the upper sand, the hydrocarbon ratio curve ranged from 3 to 5, indicating condensates or light oils.
The fourth zone, consisting of tight sandstones interbedded with shale, occurred from X,560 to X,610 ft. Here, the hydrocarbon saturation-index curve remained in the first to lower second cycle, indicating a poor hydrocarbon show.
Additionally, the hydrocarbon ratio curve ranged from 0 to 1, indicating a typical oil ratio. The hydrocarbon ratio, as well, indicated dry hydrocarbons within the tight zones and shales.
Oil-water contact
With computations from the DTG data, the fifth zone provided strong evidence of an oil-water contact. From X,610 to X,740 ft, an oil zone (Fig. 7b), consisting of a medium well-sorted sandstone with traces of chert, exhibited good-to-excellent integranular porosity ranging from 12% to 25%.
While entering this abrasive interval at X,620 ft, bit wear became obvious, as reflected in increasing penetration rates from 0.7-4.0 min/ft to 12 min/ft. The dramatic decrease in drilling rate, however, increased the dilution of the oil shows, which otherwise may have confused the operator concerning reservoir quality.
Nevertheless, before correcting the hydrocarbon saturation index for bit dullness, the upper intervals exhibited a poor to fair hydrocarbon show, remaining in the low second to upper second.
The hydrocarbon ratio ranged from 0 to 1, indicating a light-to-medium oil type. Subsequently, at a depth of X,740-X,760 ft, the operator encountered a transition zone of water saturation.
This was indicated by the hydrocarbon ratio, which increased to infinity, becoming negative afterward. Shown in sharp deflection to the left of DTG, marked "Oil-water contact" on Fig. 7b, this was later confirmed by a sharp decrease in e-log resistivity.
Acknowledgments
The authors thank Lorne Slusarchuk and the operations team of Mobil Oil Canada, Tim Blot and Bob Dick of Decollement Consulting Co., Mike Stamatedes and Allan Pennington of Meridian Resource USA, and Denver Gartner of Producers Energy for their contributions to this article.
The Authors
Kosta Zamfes is the owner of Prospectors Services International Corp., Houston, founded in 1980. Over the past 20 years, he has invented and developed numerous technologies for use in the mudlogging industry, beginning with the first computerized mud logging system in 1981 (Shell Oil).
Zamfes graduated from the University of Tashkent, Uzkekistan, with degrees in engineering and geology, a masters in geotectonics, and a math modeling degree (1966-69). In 1978, he graduated with a degree in engineering from the Polytechnic University of Greece. Finally, he completed graduate work in quantitative geology at the University of Calgary in 1985 and also holds a systems-analyst diploma from Honeywell.
Doug Bearinger is a senior staff geologist with Canadian Occidental Petroleum Ltd., Calgary, where he has explored for and developed oil and gas reservoirs in Western Canada. From 1982 to 1994, he worked as an exploration geologist for Home Oil Co. Ltd. in various plays in Canada.
Bearinger graduated in 1982 with a BSc in Applied Earth Science (First Class Honors) from the University of Waterloo, Ontario.
