How integrated exploration technology helped answer questions in an Appalachian field
FIELD MODELING-2
Conclusion
Conclusion
Independent explorationists in the relatively mature US basins require lower cost technologies as compared with 3D seismic surveys because they have less access to capital. It was this understanding that drove a project sponsored by the New York State Energy Research and Development Authority (nyserda) and completed by Direct Geochemical Services and Pyron Consulting.
A surface geochemical survey demonstration project in selected areas of Tioga County, NY, was completed during the spring and summer of 1998. The technologies utilized in this project are the types that independents can afford. They provide answers to the questions independents routinely ask (i.e., where are the hydrocarbons, how can I reduce my exploration costs and increase my success ratio, and how can I maximize my return on investment?).
The technologies discussed here are versatile tools that can be applied to field extension, infill development, and analog field modeling in a particular basin. They can also be applied to the analysis of both international concession blocks and underdeveloped US basins. This applies especially to those basins with limited subsurface data, where the lack of competition allows the acquisition of huge, affordable lease blocks and where the fruits of success will not be diluted by the "herd mentality."
The benefit of these tools, especially when combined into a coherent exploration program, is that they are inexpensive (i.e., available at a fraction of the cost of commercially available 3D seismic) and are accessible to even the smallest independent company.
These data may be applied to either small site-specific packages or to regional or basinal studies. Moreover, they can help answer the basic questions concerning the presence of petroleum and the existence of a trap. When properly used, they can enable virtually any size operator to enhance and support his drilling and development decision-making by a scientifically valid process that can be sized for a client's needs.
Methodology
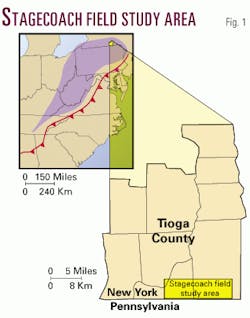
A surface geochemical survey demonstration project was completed in selected areas of Tioga County, NY, during the spring and summer of 1998 (Fig. 1). A discussion of the methodologies used in this study was presented in Part 1 of this article. In our discussion here, we will discuss only the results from our model area, Stagecoach field, Tioga County, NY.
Stagecoach field was selected as a model area because it had readily accessible data. In addition, it is a relatively unique deposit which because of its size and productivity makes it an analog for future fields that may be discovered in the Appalachian basin. It promised to yield a potentially useful and definitive surface geochemical signature that could be used to develop an exploration model for the region.
In Stagecoach field, the distribution of well bores, including productive wells, is concentrated within a 0.5-mile wide swath. This allowed the concentration of the sampling grid. Prior to the initiation of fieldwork, a grid pattern was established over the model area on the base maps.
It was decided that a 0.25-mile spacing would be adequate for the initial survey. Our field program was designed to acquire both a soil sample and a VaporTec (trademark) passive sample at each location; this allowed a comparison and verification of results obtained in the analysis of this data.
All sampling was completed along public access roads to avoid private property or in the vicinity of producing and dry wells. In all sampling, care was taken to avoid areas potentially impacted by drilling or operating processes. Sampling avoided surface drainage and occurred primarily on undisturbed land. Eighty-five locations were identified for sampling at Stagecoach field.
Data interpretation
The interpretation of the data involved two independent evaluations, followed by an integration of chemistry and geology. The ideal chemical model incorporates geologic information (i.e., reservoir conditions), lithology (log analysis), reservoir fluid analysis, well control, structural analysis, and surface geochemical information. The objective was to develop a chemical model that allowed the differentiation of potentially productive from demonstrably nonproductive or noncommercial reservoirs.
Information on the boundaries of an accumulation, the geologic conditions that create them, and the chemical features in the data that are most diagnostic of that condition enable development of such a model.
Typical of dry gases from the Appalachian basin, Stagecoach field gas is largely methane and ethane as shown in Table 1 in the first part of this article (OGJ, Sept. 11, 2000, p. 42).
In completing this gas analysis, we extended the range of analysis up to at least the C6 level because exploration is involved. In doing so, we observed detectable concentrations of C3-C5 hydrocarbons, with a trace of C6. The presence of heavier hydrocarbons gave direct evidence of the presence of thermogenic natural gas.
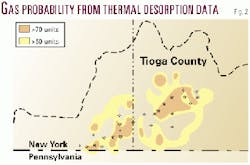
Samples that were taken in the vicinity of producing wells were used to characterize the production and were different from samples collected from dry wells. All unknown samples were then compared to the reference matrix developed from the known samples and the residual probability calculated. The residual probability is plotted on the map as "gas probability" and contoured. Fig. 2 provides the gas probability for the Stagecoach field model area based on thermal desorption.
Examination of the collected data and the maps in this section revealed that, on average, the concentration of virtually all hydrocarbons in Stagecoach field is lower in the off-field areas (i.e., background) than those within the field. This appears to be a "halo," although additional data would be needed to verify that this is the case.
Two traditional enhancements of quantitative data involve the plotting of the percent methane, or gas dryness, and the percent wetness, which is the ratio of C1 + C1 divided by C1 hydrocarbons in the soil gas.
Other ratios were examined as well, exhibiting similar patterns. Neither effectively mapped the field.
Methane (and, to a certain extent, ethane) are derived from thermogenic and biogenic sources. In a gas province, successful analysis must utilize higher number carbon compounds, but in a compositional manner. Mapping of either individual or groups of compounds allows a statistically significant variation that can accurately map the extent of gas accumulation in Stagecoach field. Therefore, the concentration data should not be used as a stand-alone, independent model for exploration for gas in the region.
Concerning the gas probability for Stagecoach field as based on the gas chromatographic analysis of soil collected samples (Fig. 2), the result is apical in nature and centered directly over the productive zones in the field. The accuracy, defined by well control, is very good, greater than 90%. As shown below, it also correlates well with nongeochemical factors. The map also indicates some potential for additional drilling sites.
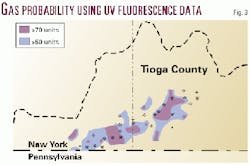
The UV fluorescence data (Fig. 3) appear to resemble the core of Stagecoach field with less overall accuracy than the light hydrocarbon analysis but with a reasonable accuracy for broad-scale reconnaissance.
Without considering other nonchemical factors, the causes for the correlation between high number carbon organics and dry gas accumulation is not obvious. In the experience of the authors, the primary chemical relationship is probably a secondary alteration effect in the soil, perhaps related to vegetative interaction with migrating hydrocarbons. The authors have frequently observed the presence of mono- and sesqui-terpenes in areas with high gas leakage and abundant vegetation (both associated with petroleum and mineral exploration). This occurs in association with the intense faulting and fracturing.
Model area geology
Stagecoach field, in southeastern Tioga County, NY, was discovered in 1987 with the drilling of the Belden and Blake (formerly Quaker State) No. 1 Fyock well. The field was confirmed with the drilling of the Belden and Blake No. 1 Racht well.
Operation of the productive wells in the field, and additional developmental drilling, was transferred to Belden and Blake Corp. in the early l990s.
Production in Stagecoach field is listed by the state agency as being from the Upper Helderberg formation (i.e., Lower Devonian). These wells produce dry natural gas with very little associated water. Based on review of NYDEC files, it appears as though many of these wells are producing through natural flow, with no completion or induced fracturing treatments.
At this writing the field contains 15 productive wells and 18 dry holes. As of early 1996, cumulative production from the field was 7.88 bcf of natural gas, with close to half of that production coming from two wells, the Belden and Blake W. Widell 1 No. 1 (2,295.36 MMcf) and the Belden and Blake E. Campbell No. 1 (1,792.65 MMcf).
Tioga County was chosen for this study because it is located at the transition of the Devonian Catskill Delta from marginal marine to deep marine depositional environments. The deeper Devonian basin lay to its south and east. Deposition in the proto-basin transitioned from carbonates in Lower Devonian time through clean sandstones in the middle Devonian though dark organic shales in the Middle through Upper Devonian as the Catskill Delta prograded into the basin proper.
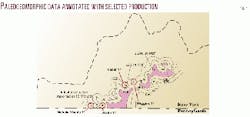
Previous published reports on Stagecoach field1 2 included a series of maps based upon both structural and isopach thickness of select intervals is found in the first of these publications. Neither the structural or isopachous maps created on various formation tops were sensitive or reliable indicators of production. The only reliable indicator of the reservoir in Stagecoach field was a paleogeomorphic or synchronous high map (Fig. 4). This map identified interval thinning typical of a paleogeomorphic high and could be correlated to hydrocarbon accumulation and production.
As verification of this analysis, the production history of select wells in the field provided a good basis for appraising the validity of application. The Belden and Blake No. 1 Widell well (cumulative production 2.295 bcf) has a paleogeomorphic thickness of 644 ft, while the Belden and Blake No. 1 Fyock (cumulative production 8.9 MMcf) has a paleogeomorphic thickness of 718 ft.
After publication of the 1997 papers, the operator drilled four additional wells in Stagecoach field. Of those new wells, two were productive and two were dry. The two productive wells were located in favorable positions relative to the paleogeomorphic thin, while the two dry holes were located in a less favorable position relative to the paleogeomorphic thin.
This corroborates the assumption that wells located closer to the paleogeomorphic thin (i.e., thinning of the interval) with well-established fractures will host more economic production than similarly fractured wells located in thicker paleogeomorphic intervals.
Geochem model development
Historically, the use of geochemical methods in the exploration for hydrocarbons arose from the knowledge that there were surface manifestations of hydrocarbons at depth that could not easily be seen by skilled observers.
The goal of explorationists and investors was to use the method to quantify and qualify those manifestations to maximize exploration success. In order to provide context to the geochemical analysis of the model area, previously published data on Stagecoach field were analyzed. In addition, data from a remote sensing study completed by one of the team members was used to provide further context. The discussion that follows is a shorten version of our results.
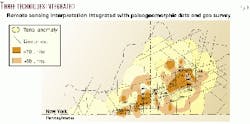
The remote sensing analysis (Fig. 5) is extracted from a larger study of the Central New York area completed by the author Pyron. The extracted interpretation has been annotated by installing a layer of data that shows the location of wells in Stagecoach field.
The interpretation of this image revealed a variety of well-established NE-SW and NW-SE trending lineaments. In addition, during the interpretation, a bias to ignore prominent E-W features was imposed because this direction tracks the processing graining of the image.
A series of N-S lineaments reflect local fault structures, or internal fracturing of the basement and overlying rocks associated with compressional and extensional tectonics. There are also two E-W lineaments that follow the trend of the Elmira anticline, a known surface feature. Given the frequency of the lineaments and the overlapping nature of the patterns, it is logical to conclude that fracture porosity will enhance the productivity of reservoirs when they are encountered.
The observed tonal anomalies are very distinct and have a bright character, which implies that the reservoir rocks are competently sealed and that they host nondepleted accumulations of hydrocarbons. Significantly, the existing production in the area does not account for the intensity or density of the tonal anomalies. This suggests that additional, nondeveloped reservoirs may exist below those currently developed in the Stagecoach field area.
This study was designed to develop an exploration model that could provide a low cost, accurate tool (or combination of tools) that independent exploration and development companies could use in the Appalachian basin. The exploration model we have developed for this basin is called the Integrated Exploration Technology (IET).
IET incorporates several proprietary, but readily available, tools, including surface geochemical data (light and heavy hydrocarbon analysis of soils and-or free soil gas, as appropriate to the target), remote sensing, paleogeomorphic mapping, gravity, and other synoptic data as available, and an electronic assimilation of geologic and historical production information. Each of these data sources is developed as a layer of information, which can then be added to other layers to form an information product.
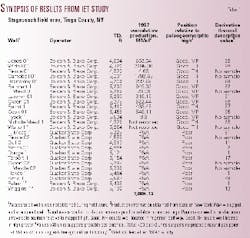
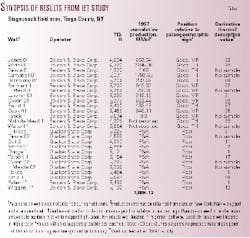
Surface geochemical data (Table 1, this article) provide potentially three key pieces of information about a site or region. First, they provide broad-based evidence of petroleum hydrocarbon presence and variations in concentration. Second, using both generalized and site specific compositional data, it can yield valuable prospect-specific information to target detailed investigations and drilling programs. It is possible to state whether the study area appears to have accumulations of gas, oil, or both and, under the proper conditions, can suggest the structural character in areas of high fracturing and faulting.
Third, when these elements are integrated, the best wells in Stagecoach field are located in favorable positions relative to the paleogeomorphic map, the geochemical gas probability map, and the regional Landsat lineament and tonal anomaly maps. The integration of each element merits some additional discussion.
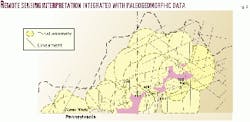
The first map presented is the integration of the remote sensing data with the paleogeomorphic map (Fig. 6). The paleogeomorphic thin is located within an area in which the tonal anomalies are overlapped. In addition, the frequency of cross lineaments suggests that the reservoirs may have enhanced fracture porosity.
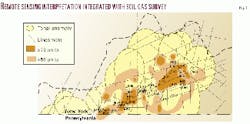
The second map provides an integration of the remote sensing with the soil gas data (Fig. 7). The areas that have the best potential, as based upon the geochemical data, coincide with the overlapping tonal anomalies.
A third map (Fig. 8) shows the paleo-geomorphic map data overlying the geochemical gas probability data. Again there is a coincidence between the most favorable areas, as based upon the geochemical data, and the areas adjacent to or within the paleogeomorphic thin. Interestingly, the best wells in the field are located in the areas in which the favorable positions on both the paleogeomorphic map and the geochemical data overlap.
What it means
When the data are integrated (Fig. 9), the paleogeomorphic thins overlie both the best areas as defined by the gas probability study and the areas in which a tonal anomaly swarm is present. There is a coincidence of the integrated favorable areas and the most productive wells in the field.
Our data suggest additional infill or developmental locations still exist within the field. With the integration of select geophysical data, a complete exploration package could easily be assembled.
Given that exploration programs must meet imposed budgetary constraints, the bulk of this study could have been completed for a relatively low fee (estimated to be $5,000-10,000 US per drilling site) that would not severely impact either out of pocket costs or the promotional fees associated with prospect development.
Acknowledgments
Direct Geochemical Services and Pyron Consulting thank the NYSERDA and Dr. John Martin, the project manager for our study. We also thank the many geologists and other professionals who reviewed our final report and commented on our public presentations on this topic. Limited copies of the project final report are available from the authors and NYSERDA.
References
- Pyron, A.J., "Application of paleogeomorphic mapping technique to the subsurface evaluation of the Appalachian basin of New York; three study areas in south-central and southeastern New York," IOGA-NY summer meeting, July, 1997.
- 2. Pyron, A.J., "Paleogeomorphic mapping applied to Stagecoach field, NY, OGJ, Dec. 22, 1997, pp. 106-110.
