EPA group verifies performance of greenhouse gas emissions-mitigation technologies
The Greenhouse Gas Technology Verification Center (GGTVC) is one of 12 independently operated organizations established by the US Environmental Protection Agency to verify environmental technology.
GGTVC provides third-party performance data to industry and other stakeholders needing reliable data on technologies that reduce or monitor greenhouse gases (GHGs).
To ensure that broadly acceptable verification is conducted on technologies of the greatest interest, an advisory panel-consisting of technology purchasers in industry, facility operators, technology developers, technology vendors, financiers, and others-routinely advise GGTVC on which technologies to test and how to test them.
Since 1998, GGTVC has verified devices that mitigate and recover leaking natural gas at gas transmission facilities and devices that reduce leakage from volatile organic liquid (VOL) storage systems.
GGTVC is also verifying the technical and economic performance of a microturbine generator that has been placed into electricity-production service at a natural gas compressor station and a new air-to-fuel ratio controller for lean-burn internal combustion (IC) engines.
This article presents a synopsis of four recent verifications conducted by GGTVC: two on devices that capture and recover leaking gas from gas compressors; one on a new software-based, continuous-emission monitor for natural-gas-fired engines; and one on a device that reduces emissions from VOL storage tanks. Plans for the microturbine and air-to-fuel ratio controller verifications are also described.
Introduction and background
Since the early 1990s, government and private groups in the US have identified the lack of independent and credible third-party performance data as a major impediment to the acceptance and use of innovative environmental technologies.
It is recognized that technology buyers need such data to make informed technology purchase decisions. To satisfy this need, EPA implemented an initiative geared to accelerate the adoption of environmental technologies.
The initiative, referred to as the Environmental Technology Verification (ETV) program, provides independent verification and reporting of technology performance under strict quality assurance guidelines.1
Twelve independent verification organizations have been established under the ETV program, each with a unique technology focus and operation. Although different in many ways, all these organizations share a common set of operating principles: participation is voluntary, only commercially available technologies are verified, ETV does not "certify" or approve technologies, and verifications must maintain a high degree of quality, transparency, and fairness.
Among the most important ETV program principles is that the verification process is stakeholder-driven; meaning that technology purchasers, developers, vendors, and others direct GGTVC on which technologies to test and how to test them.
In 1995, EPA began to establish public-private partnerships with private companies and national laboratories to verify a broad array of environmental technologies. One of these partnerships resulted in the formation of GGTVC. It is a partnership between Southern Research Institute (SRI) and EPA's National Risk Management Research Laboratory.
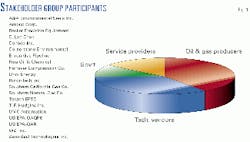
In 1998, GGTVC formed the Oil and Gas Industries Stakeholder Group. This group includes large and small oil and gas producers, industry service providers, technology vendors, trade organizations, and government groups. Fig. 1 shows the participating organizations represented and the group's composition.
The group first met June 23-24, 1998, in Houston and identified seven high-priority technologies in need of verification; they also voiced support for GGTVC's mission and expressed a preference for verifications conducted in actual field settings.
The group emphasized that verification of technology cost and economic payback is critical for industry acceptance of new products. After the Houston meeting, vendors of GHG-mitigation devices were solicited in several top-rated technology areas, and some vendors contacted GGTVC directly to request verification.
Verification testing was started on several natural gas compressor leak mitigation devices and other technologies applicable to the oil and gas industries.
Verification results
In the natural gas industry, leaks from reciprocating compressors are significant. These leaks are most often associated with compressor rod packing, unit isolation and other valves, blowdown operations, and miscellaneous fugitive sources.
A significant source of these emissions is the leakage associated with compressor rod packing at gas transmission stations.2 Emissions reduction and recovery of this gas provides two benefits: the reduction of GHGs and the recovery of lost economic and natural resources.
GGTVC has verified two technologies that reduce and recover leaking gas from compressor-rod packing, and both are discussed later, along with verification results of a new technology for the continuous monitoring of IC engines. This technology is software-based, and it monitors emissions without the use of expensive, continuous-monitoring hardware.
Finally, verification results are presented for a new low-emission pressure relief valve (PRV). The valve is applicable to tanks that are used to store VOLs, including crude oil, synthetic organic chemicals, and other compounds.
All verification testing and analysis is conducted by GGTVC, and complete verification results are available free at two web sites: www.sri-rtp.com and www.epa.gov/etv.
Technologies tested
This article details the verification results associated with two compressor rod leak recovery devices. Both devices are applicable to reciprocating natural gas compressors, and both were installed and tested at transmission compressor stations in the US.
In addition to verifying the field installation cost for each technology, leak-tightness and gas-recovery rates were measured. The seal assist system (SAS), offered by A&A Environmental Seals Inc., La Marque, Tex., recovered on average about 70% of the estimated rod packing leaks. The system also exhibited significant fluctuations in gas recovery and leak-tightness performance.
The Static Pac, offered by C. Lee Cook of Louisville, Ky., is used during standby compressor operations. During testing, the system recovered an average of 96% of the gas that would have leaked had the system not been applied. Static Pac gas-recovery performance was consistently high.
GGTVC also verified a parametric emission monitoring system (PEMS). The system monitors continuous emissions of several pollutant species on gas-fired IC engines, and offers the advantage that conventional continuous stack-monitoring hardware is not required. ANR Pipeline Co., Detroit, offers the system.
Based on verification testing conducted by GGTVC, the system was found to predict emissions of nitrogen oxides, carbon monoxide, and carbon dioxide, with an accuracy that is well within EPA's performance specification of 20% relative accuracy (defined later).
The accuracy for total hydrocarbons (THC) was found to be well outside this 20% guideline. This is due, in large part, to an instrumental bias detected by GGTVC during PEMS initialization activities and not the PEMS system itself.
Verification is nearing completion on a new low-emission PRV for low-pressure (VOL) storage tanks.
The device, the Pin-Tech Bubble Tight, is a <500-ppm PRV, is offered by Protectoseal Co. of Bensenville, Ill., and is applicable to crude oil storage tanks and other oil production and processing storage applications. The leak-tightness of several Pin-Tech PRV sizes and models were verified, as were other performance parameters.
In a baseline comparison with standard industry PRV technology, the Pin-Tech device demonstrated significantly improved performance.
GGTVC plans to continue verifying new technologies applicable to the oil and gas industries. A new technology verification is under way to measure performance parameters on Honeywell Power Systems' Parallon 75-kw microturbine.
The Parallon is being tested at a natural gas compressor station, where it operates in peak shaving service. GGTVC expects test results by late 2000. Testing of a new air-to-fuel ratio controller for lean-burn IC engines is also planned for 2000. The controller, offered by the MIRATECH Corp., is being evaluated at a natural gas compressor station in the US.
Seal assist system
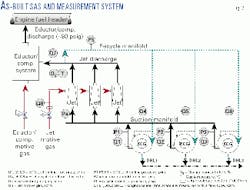
A&A's SAS is designed to contain leaks from the rod packing in natural gas compressors and prevent their escaping into the atmosphere. The SAS allows existing rod packing leaks to continue but contains the leak within a secondary emissions containment gland (ECG). The contained gas is then recompressed and routed to the compressor engine for use as fuel.
The SAS consists of three primary components: the ECG, a set of jets that provide a motive force to move collected gas through the system, and an eductor-compressor that repressurizes the collected gas for introduction into the engine fuel line.
The ECG is surface-mounted to the low-pressure side of an existing rod seal packing case, and its primary function is to collect rod emissions and prevent them from entering the atmosphere.
The SAS was verified at a natural gas compressor station operated by Transwestern Natural Gas Pipeline Co., an Enron Gas Pipeline Group unit. Three ECG glands were installed on three 4.5-in. compressor rods, and gas collection-compressor components were installed to provide fuel to the station's 4000-hp, gas-fired engines.
Specific verification goals were to measure and verify SAS leak tightness, gas recovery, and methane emissions reduction. Installation and operating costs were also verified. Test results consist of initial installation data and measurements collected during Mar. 10-31, 1999.
The verification methods applied and major findings are gas recovery, SAS leak-tightness, methane emission reduction potential, cost, and operating performance.
The gas recovery was determined using continuous-sampling, mass-flow meters to measure the gas flow the SAS delivers to the engine fuel line and the gas flow from jets that provide motive force (Fig. 2, Q7 and Q8).
Both flows are combined by the SAS piping and fed to the engine, and motive gas flow values are subtracted from the gas fed to the engine to make gas recovery values reflective of the emissions captured.
Gas leaks from the system-determined as described in the next section on SAS leak-tightness determinations-are also subtracted from the gas fed to the engine. During the verification period, the SAS recovered 3.7-11.6 scfm of gas for use as engine fuel.
The average gas recovery rate over the test period was 7.2 plus or minus 0.22 scfm natural gas (an estimated leak capture efficiency of 70%).
Most of the SAS assembly was found to be leak-tight, based on initial system pressure tests and post-installation, visual leak-detection surveys. The only exception was the ECGs, which were found to leak repeatedly.
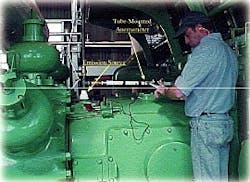
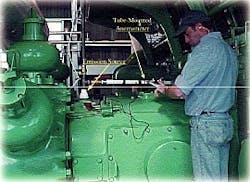
Based on 12 individual measurements conducted on two occasions, the ECGs were found to leak methane at a rate of 0-5.7 scfm. A sensitive, tube-mounted vane anemometer was used to measure methane leak rates from the ECGs on each compressor. ECG leaks are liberated into the distance piece, or "doghouse," located between the engine and compressor.
Because the doghouse is vented to a station-wide vent system, emission rates were measured by disconnecting the vent pipe at the doghouse vent exit and measuring gas flow rates with the anemometer. Gas composition was also determined using a Bascom-Turner organic vapor analyzer (CGI-201).
Due to operation problems at the site, reliable methane emissions-reduction potential estimates could not be obtained. GGTVC is collecting additional verification data in Phase II, which will be used to assess emissions reduction potentials and other performance characteristics. Cost was verified independently by GGTVC based on vendor-supplied capital cost quotes and installation contractor records.
The cost of the SAS installation (capital and labor) was $42,774 at the test site (three compressors). Regarding operating performance, maximum gas recovery was achieved when ECG suction pressures were negative.
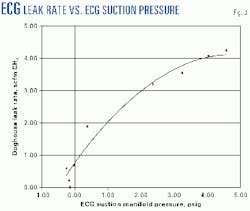
The SAS was unable to consistently maintain these negative pressures due to fluctuations in engine operations, rod emission rates, and SAS design deficiencies. This resulted in a continuous leak from tertiary seals on the ECGs. The relationship between ECG suction pressure and tertiary seal leak rates can be seen in Fig. 3.
A Phase II effort is under way to characterize additional performance parameters, more fully assess the performance parameters previously discussed, and calculate economic payback and emission reductions for the SAS as installed at the test site. Results are expected late in 2000.
Static Pac
Gas can leak from compressor rod packing during operation and, in some cases, when the compressor is in a standby mode. Standby mode, commonly encountered in the industry, helps ensure that compressors can quickly return to operation in response to changing pipeline demand.
Significant gas savings and emissions reductions can occur if rod packing leakage during standby operations is reduced or eliminated.
The C. Lee Cook Static Pac is a gas leak containment device designed to prevent rod packing leaks during pressurized compressor standby periods. The Static Pac system is installed in a conventional packing case by replacing several rings (typically two) in the low-pressure side of the packing case.
Upon shutdown of the compressor, a control system activates the Static Pac to move a piston along the outer shell of the Static Pac seal, wedging a lip seal into contact with the rod. Prior to engine restart, the piston retracts, releasing the Static Pac seal.
The Static Pac was verified at a natural gas compressor station operated by ANR. The test was carried out on two 8-cylinder, 2000-hp engines, each equipped with two reciprocating compressors (4-in. rods).
The goals of the verification test were to measure and verify Static Pac gas savings and document installation costs. To accomplish this, the Static Pac, with new packing, was installed on a single compressor rod (the test rod) on each of the two engines.
The remaining rods, equipped with new conventional packing, served as control rods against which Static Pac performance was compared. Emission rates were measured with a sensitive, tube-mounted vane anemometer.
Testing was conducted during July 15-Aug. 6, 1999, when five sets of emission measurements were made on each of the four compressors included in the verification (two control rods and two test rods). Each set of measurements consisted of emission rate determinations for both the test and control rods during operation and idle modes, and each individual determination involved the collection of 10 individual measurements.
The verification results are as follows:
- Methane emission reduction. The Static Pac reduced 96% of rod packing emissions while the compressor was in a standby, pressurized state.
The overall average methane emission reduction was 0.66 scfm/Static Pac-equipped rod. Total savings will vary depending on the uncontrolled emission characteristics of the rod on which the Static Pac is installed.
- Missing seal impact. The Static Pac requires removing a rod seal to make room for the Static Pac components, resulting in a reduction of sealing components compared with a conventional packing case.
No significant differences in operating rod emissions were measured between the test rods and control rods, indicating that the missing seal does not increase normal operating emissions.
- Initial costs. Equipment cost for the Static Pac system was $2,638/rod greater than the capital cost for a conventional packing case. Considering installation labor, the total incremental cost for modifying a conventional packing case with the Static Pac was $3,483/rod at the test site.
Gas savings from the Static Pac will occur only if a pressurized standby operational mode is maintained. Different shutdown procedures are used when entering the standby mode, the most common being to either blow down all pressure to the atmosphere, or maintain compressor pressure.
Both procedures produce different emissions, so if Static Pacs are installed, and the operator changes from a blowdown to a pressurized shutdown, some emissions will increase (e.g., valves, packing cases, fittings), while others will decrease (e.g., the blowdown volume and unit valve leaks are saved).
Net impact of changes
To examine the net impact of these changes, GGTVC measured emissions from all leaking components associated with the test compressors. This included the unit valves, blowdown valves, PRVs, fittings, and other components found to be leaking during shutdown and idle mode operation.
Both nonpressurized and pressurized shutdowns were examined. Leak rates were measured using a combination of different methods, including the flow tube described earlier, and a low flow rotameter.
Thirty individual emissions rate determinations were conducted during the sampling period identified above, and for each leaking device, about 5 individual measurements were made.
These measurements, together with estimated blowdown emissions, were used to determine the net gas savings associated with both the pressurized and nonpressurized shutdown modes. GGTVC monitored compressor operations for about 20 days to determine the actual number of shutdowns and idle hours experienced on the test compressors. During this period, compressor idle operations occurred 9-19% of the time.
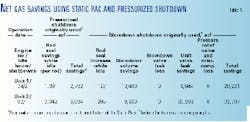
Table 1 presents net gas savings estimates for the two test engines, assuming both compressors on each engine are equipped with Static Pacs. If, prior to Static Pac installation, the compressors remained pressurized during standby, then a change to a pressurized shutdown procedure is unnecessary, and emissions of leaking components associated with the compressor continue unchanged.
In this case, the Static Pac provides all of the gas savings, and the net gas savings occurring over idle periods are estimated at an average of 4,733 scf of natural gas (an average of 41 scf/idle hour/rod).
Rod emissions at the test site were generally lower than literature-reported values (average of 1.86 scfm),2 so national average savings may be higher than the values reported here.
If it were assumed that, prior to Static Pac installation, the test compressors were blown down prior to standby operation, then a change to a pressurized shutdown procedure would occur after Static Pac installation.
In this case, the average net savings for the test engines is estimated to be much higher at 30,504 scf (average of 616 scf of natural gas/standby hour). The Static Pac enables a pressurized shutdown with very low rod emissions, and the change in operating characteristics, particularly the elimination of blowdowns to the atmosphere, provides significant gas savings.
A small increase in rod emissions is reported because the Static Pac does not reduce 100% of rod leaks during idle periods.
The Static Pac will be tested continuously for an additional 4 months, after which a Phase II report containing medium-term technical and economic payback performance will be issued.
PEMS
ANR has developed a PEMS that provides continuous monitoring of air emissions from gas-fired IC engines. The ANR PEMS does not require installation of instrumented continuous-emissions monitoring systems (CEMS), but does continuously monitor CO2, CO, THC, and NOx.
Such systems are based on establishing relationships between engine operating parameters, as determined by existing engine sensors, and exhaust emissions. As such, they are fundamentally computerized algorithms that describe the relationships between operating parameters and emission rates.
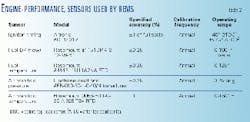
The ANR PEMS was verified on a 6000-hp, gas-fired reciprocating engine located at an ANR gas transmission compressor station. Table 2 identifies the engine sensors that provided input to the PEMS during verification testing.
The primary verification parameter assessed is relative accuracy (RA), which is the accuracy of the PEMS predictions relative to the measured values. This parameter was assessed through collection and analysis of emissions data generated by the PEMS, comparative EPA reference method gas measurements, engine data logs, and ANR-supplied data on engine operations.
EPA performance specification test procedures (40 CFR Part 60, Appendix B) were used to determine the relative accuracy of the PEMS with respect to emission prediction capabilities for NOx, CO, THC, and CO2.
As required by the performance specifications, EPA reference methods were used to measure actual pollutant concentrations and emission rates for comparison with the PEMS predictions.3
Twelve tests, each 21 min in duration, were conducted in order to determine RA for each pollutant. Since engine speed and torque are primary determinants of engine emissions, the tests were conducted while operating at four different speed and torque conditions within the normal operating range of the test engine.
The RA test results were determined based on two emission units: grams per brake horsepower hour and parts per million by volume (Table 3).
Based on the 12 runs, the RA is defined as the run-average difference between actual emissions (based on EPA reference methods) and predicted emissions (PEMS output) divided by the reference method value and multiplied by 100. Table 3 also presents the mean absolute difference in emissions between the reference method and PEMS predictions and the standard deviation of the differences.
The calculated RAs for NOx, CO, and CO2 were well within EPA's performance specification for CEMS (20%). This indicates that the PEMS has excellent emissions-prediction capabilities for these pollutants; at least as good as CEMS.
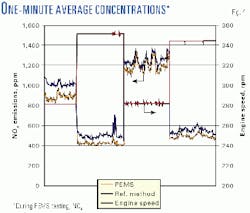
In a plot of the 1-min average NOx concentrations determined by the PEMS and instrumental methods throughout the RA testing, the PEMS followed actual NOx values well, even during periods of significant change (Fig. 4).
The calculated RA for THC was outside the 20% value specified for CEMS at 34.2%. The difference between measured and predicted THC emissions are consistent with, and likely related to, an offset of 34% observed between the testing contractor used by ANR to map the PEMS and the verification testing team's sampling system.
Additional testing of the PEMS was conducted while the engine operated under abnormal operating conditions and during simulated engine sensor failure.
To evaluate the PEMS ability to respond to abnormal engine operations, a series of tests were conducted while physically perturbing several key engine operating characteristics, including air manifold temperature and pressure, ignition timing, and engine efficiency.
Emission changes occurring as a result of changes in the operating parameters may vary in significance depending on engine torque and speed settings, so engine perturbations were conducted at three torque and speed operating regimes, resulting in a total of 24 individual test runs. A total of 20 more test runs were conducted while electronically changing engine sensor outputs to simulate sensor failure. The results of these tests are too complex for presentation here, but can be obtained by accessing GGTVC's web site at www.sri-rtp.com.
VOL tank PRV
Verification was recently completed on a new low-emission PRV valve for low-pressure VOL storage tanks that is offered by Protectoseal and is applicable to crude oil storage tanks and other oil production and chemical processing storage applications.
The Pin-Tech PRV incorporates a unique buckling pin that is designed to set the relief pressure and keep the valve from leaking volatile organic compounds and GHGs when in the nonventing mode (i.e., prior to reaching the valve relief pressure).
The GGTVC verified the leak-tightness of several Pin-Tech PRV sizes and models. This included the 2-in. and 24-in. direct-acting valves and the 2-in. and 24-in. diaphragm-assisted valves. Each was tested by incrementally increasing the pressure on each valve until the valve relieved.
Emission concentrations were measured at the valve seal interface while operating in the nonventing mode. Based on these measurements, emissions were found never to be greater than 25 ppmv, which is well below the 500 ppmv screening concentration specified by equipment leak requirements found in Parts 60, 61, and 63 of Title 40 of the Code of Federal Regulations.
To assess the emissions reduction potential of the Pin-Tech devices tested, a leak performance test was performed on typical baseline technologies, two weight-loaded conventional pressure relief valves.
The leak tightness of these baseline valves were tested in the same manner as the Pin-Tech devices. Both baseline values were found to exceed 1,000 ppmv screening concentration values before the relief pressure set points were reached.
Other verifications
MIRATECH submitted the GECO 3001 air-fuel ratio (AFR) controller for independent performance verification by GGTVC.
Initial plans call for evaluation to be conducted on two identical lean-burn IC engines operating under similar conditions. One engine will be equipped with the AFR controller and will serve as the test engine. The remaining engine will serve as the control engine.
The evaluation will characterize-via measurements and comparisons between the two engines-fuel consumption rates, fuel savings, engine efficiency, GHG, NOx, CO, and THC emission rates; GHG and NOx emission reductions; and potential enhancements to lubrication oil life. The evaluation will be conducted over a 3-month period, and field testing is expected to be completed by April 2001.
A complete test plan and verification report should be available in January 2001 on GGTVC's web site.
Honeywell Power Systems, formerly AlliedSignal Power Systems Inc., is participating in an independent performance verification of Honeywell's 75-kw microturbine, the Parallon.
The Parallon is a compact, self-contained unit that uses a microturbine to convert natural gas or other fuels into electricity for on-site power generation.
Microturbines are a relatively new technology based on well-established turbine technology designs, and several members of the Oil and Gas Industries Stakeholder Group have urged GGTVC to evaluate microturbines for use in natural gas and oil industry applications.
GGTVC is verifying the Parallon's performance to determine its viability as a peak shaving power source for use at natural gas transmission stations. The verification is being conducted at an Enron-operated gas transmission station in Melbourne, Fla., and it addresses a range of technical, economic, emissions, and operational performance characteristics.
GGTVC will initially verify the performance of a single commercial unit in peak shaving service over a 1-month period. The variables verified include power production and quality; energy conversion efficiency; capital, installation, and operating and maintenance costs; emission rates of criteria pollutants and GHG species; GHG emissions reduction; installation and start-up requirements; and compatibility with existing electrical systems.
Actual field testing is scheduled to begin in late summer 2000 and continue into 2001.
Acknowledgements
The authors wish to thank the companies hosting the testing activities described here: Enron Gas Pipeline Group, Transwestern Natural Gas Pipeline, ANR Pipeline Co., Florida Gas Transmission, and Northern Natural Gas. We are also grateful for the support, guidance, and outreach efforts of the US EPA Natural Gas STAR program, the Petroleum Technology Transfer Council, and the Gas Research Institute.
References
- US Environmental Protection Agency, "Environmental Technology Verification Program: Verification Strategy," Report No. EPA/600/K-96/003 (NTIS PB97-160006), 22 pp., Office of Research and Development, Washington, DC, February 1997.
- GRI 1997, "Documentation of Existing Rod Packing Technology and Emissions." GRI-97/0393, Gas Research Institute, Chicago, December 1997.
- US EPA, "Reference Methods 3A, 6C, 7E, 10, 19, and 25A Determination of Carbon Dioxide and Oxygen, Sulfur Dioxide, Oxides of Nitrogen, Emission Rate, and Total Gaseous Organic Concentration," Code of Federal Regulations, Title 40, Pt. 60, Appendix A, 1999.
The authors-
Stephen D. Piccot is the Southern Research Institute's director of the Greenhouse Gas Technology Verification Center and an environmental engineer with 20 years' experience in air pollution research and regulation. He has conducted greenhouse gas technology assessment, inventory development, modeling, and planning projects for the past 12 years. Previously, Piccot assisted the US Environmental Protection Agency in the assessment and specification of air pollution control requirements for sources ranging from industrial combustion equipment and sewage sludge incinerators, to synthetic organic chemical manufacturing facilities and small-scale combustion and printing operations.
David A. Kirchgessner has been with the US Environmental Protection Agency's Office of Research and Development, Research Triangle Park, NC, for 25 years. During that time he has worked on the characterization of fossil fuels and their wastes, pollution control development projects, and most recently, greenhouse gas emissions from the fossil fuel industries.
