HYDROSTATIC TESTING-1: Pressure ratios key to effectiveness; in-line inspection complements
A review of literature and reported operating experience on the use of hydrostatic testing to verify pipeline integrity suggests that the test-pressure-to-operating-pressure ratio measures the effectiveness of the test and that in-line inspection is usually preferable to hydrostatic testing.
Moreover, testing to actual yield is acceptable for modern materials.
Pressure reversals, if they occur, tend to erode confidence in the effectiveness of a test but usually not to a significant degree; minimizing test-pressure cycles minimizes the chance for pressure reversals.
These findings form the first of this two-part series on hydrostatic testing.
The concluding article (Aug. 7, 2000) deals with the issue that, because hydrostatic testing can leave behind defects that could be detected by in-line inspection, the use of hydrostatic testing often demonstrates serviceability for only a short period of time if a defect-growth mechanism exists.
Debate
Some say that hydrostatic testing damages a pipeline especially if carried out to levels of 100% of more of the specified minimum yield strength (SMYS) of the pipe material. These people assert that if it is done at all, it should be limited to levels of around 90% SMYS.
Others insist that pipelines should be retested periodically to ensure their serviceability.
The reality is that if and when it is appropriate to test a pipeline, the test should be carried out at the highest possible level that can feasibly be done without creating numerous test failures.
The challenge is to determine if and when it should be done, the appropriate test level, and the test-section logistics that will maximize the effectiveness of the test.
The technology to meet these challenges has been known for 30 years. Nothing has arisen in the meantime to refute this technology. The problem is that people both within and outside the pipe industry are unaware of the technology, have forgotten it, or for political reasons are choosing to ignore it.
This article shows the following:
- It makes sense to test a new pipeline to a minimum of 100% SMYS at the highest elevation in the test section.
- Pipe that meets the specified minimum yield strength is not likely to be appreciably expanded even if the maximum test pressure is 110% SMYS,
- If hydrostatic retesting is to be conducted to revalidate the serviceability of a pipeline suspected to contain defects that are becoming larger with time in service, the highest feasible test pressure level should be used.
- If the time-dependent defects can be located reliably by means of an in-line-inspection tool, using the tool is usually preferable to hydrostatic testing.
We also note the following as reminders:
- When a pipeline is tested to a level in excess of 100% SMYS, a pressure-volume plot should be made to limit yielding.
- A test may be terminated short of the initial pressure target, if necessary, to limit the number of test breaks as long as the MOP guaranteed by the test is acceptable to the pipeline's operator.
And, we suggest that:
- Test-section length should be limited to prevent elevation differences within a test section from exceeding 300 ft.
- The pressure level for verifying integrity can be higher than the level needed to validate the MOP of the pipeline, and the integrity test to a level above 1.25 times MOP, if used, needs to be no longer than 2 hr.
Planned conversion
The concept and value of high-pressure hydrostatic testing of cross-country pipelines were first demonstrated by Texas Eastern Transmission Corp. The company sought the advice of Battelle Laboratories, Columbus, Ohio, in the early 1950s as it began to rehabilitate the War Emergency Pipelines and convert them to natural gas service.
Before testing, these pipelines failed frequently in service because of original manufacturing defects in the pipe. The Battelle staff recommended hydrostatic testing to eliminate as many of these defects as possible.
After the pipeline had been tested to levels of 100 to 109% SMYS during which time "hundreds" of test breaks occurred, not one in-service failure caused by a manufacturing defect occurred.
The news of this successful use of hydrostatic testing spread quickly to other pipeline operators, and by the late 1960s the ASA B31.8 Committee (forerunner of ASME B31.8) had established an enormous database of thousands of miles of pipelines that had exhibited no in-service ruptures from original manufacturing or construction defects after having been hydrostatically tested to levels at or greater than 90% SMYS.1
These data were used to establish the standard practice and ASA B31.8 Code requirement that prior to service, each gas pipeline should be hydrostatically tested to 1.25 times its maximum allowable operating pressure. Later, a similar requirement for liquid pipelines was inserted into the ASME B31.4 Code.
When US federal regulations for pipelines came along, the precedent set by the industry of testing to 1.25 times the MOP was adopted as a legal requirement.
Both field experience and full-scale laboratory tests have revealed much about the benefits and limitations of hydrostatic testing, including the following:
- Longitudinally oriented defects in pipe materials have unique failure-pressure levels that are predictable on the basis of the axial lengths and maximum depths of the defects and the geometry of the pipe and its material properties.2
- The higher the test pressure, the smaller the defects, if any, that survive the test.
- With increasing pressure, defects in a typical line-pipe material begin to grow by ductile tearing prior to failure. If the defect is close enough to failure, the ductile tearing that occurs prior to failure will continue even if pressurization is stopped and the pressure is held constant.
The damage created by this tearing when the defect is about to fail can be severe enough that if pressurization is stopped and the pressure released, the defect may fail upon a second or subsequent pressurization at a pressure level less than the level reached on the first pressurization.
This phenomenon is referred to as a "pressure reversal."3 4
- Testing a pipeline to its actual yield strength can cause some pipe to expand plastically, but the number of pipes affected and the amount of expansion will be small if a pressure-volume plot is made during testing and the test is terminated with an acceptably small offset volume or reduction in the pressure-volume slope.5
Ratio
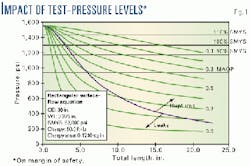
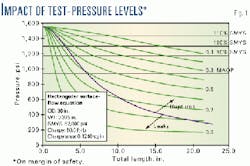
Fig. 1 validates the hypothesis that "the higher the test-pressure-to-operating-pressure ratio, the more effective the test." It presents a set of failure-pressure-vs.-defect-size relationships for a specific diameter, wall thickness, and grade of pipe.
A great deal of testing of line-pipe materials over the years has validated these curves.2 Each curve represents a flaw with a uniform depth-to-wall-thickness ratio. Nine such curves are given (OD/WT ranging from 0.1 to 0.9).
Consider the maximum operating pressure (MOP) for the pipeline (the pressure level corresponding to 72% SMYS. Fig. 1 presents that pressure level by the horizontal line labeled MOP.
At the MOP, no defect longer than 10 in. and deeper than 50% WT can exist. Any such defect would have failed in service. Similarly, no defect longer than 4 in. and deeper than 70% WT can exist, nor can one that is longer than 16 in. and deeper than 40% WT.
By raising the pressure level to greater than the MOP in a hydrostatic test, the pipeline's operator can ensure the absence of defects smaller than those that would fail at the MOP.
For example, at a test pressure level equivalent to 90% SMYS, Fig. 1 determines the largest surviving defects by the horizontal line labeled 90% SMYS.
At that level, the longest surviving defect that is 50% through the wall can be only about 4.5 in. Compare that length to the length of the longest possible 50%-through flaw at the MOP; it was 10 in.
Alternatively, consider the minimum survivable depth at 90% SMYS for a 10-in. long defect (the size that fails at the MOP if it is 50% through the wall). The survivable depth is only about 32% through the wall.
By a similar process of reasoning, one can show that even smaller flaws are ensured by tests to 100 or 110% SMYS (the horizontal lines drawn at those pressure levels on Fig. 1).
The point is that the higher the test pressure above MOP, the smaller will be the possible surviving flaws. This fact means a larger size margin between flaw sizes left after the test and the sizes of flaws that would cause a failure at the MOP.
If operating pressure cycles can extend surviving flaws, the higher test pressure will ensure that it takes a longer time for these smaller flaws to grow to a size that will fail at the MOP.
Thus, Fig. 1 provides proof of the validity of the hypothesis: the higher the test-pressure-to-operating-pressure ratio, the more effective the test.
Exceeding 100% SMYS
Given the previous argument for testing to the highest feasible level, one needs to consider practical upper limits. In the case of a new pipeline constructed of modern high-quality, high-toughness line pipe, the maximum test level can generally exceed 100% SMYS. Reasons that this will not cause significant yielding of the pipe are as follows.
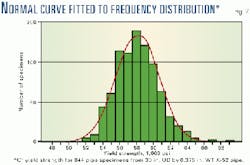
First, Fig. 2 shows that the average yield strength of an order of pipe is usually considerably above the minimum specified value. Very few pieces will have yield strengths low enough to cause yielding at 100% SMYS.
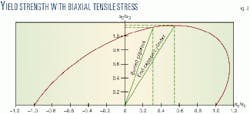
Secondly, when a buried pipeline is pressurized, it is restrained by the soil from shortening in the axial direction. This causes an axial tensile stress equal to Poisson's ratio times the hoop stress (Poisson's ratio is 0.3 for steel). Fig. 3 shows what this means to testing to more than 100% SMYS.
The tensile test commonly used to assess the yield strength of line pipe is a transverse, flattened uni-axial specimen designed to test the circumferential (hoop) direction tensile properties.
A test of such a specimen reveals a unique value of yield strength at a certain value of applied stress. In Fig. 3, that value is 1.0 on the circumferential tensile stress to uni-axial yield stress ratio (vertical) axis.
If one were to test the same type of specimen with a longitudinal specimen, the unique yield strength measured in the test could be plotted on Fig. 3 at 1.0 on the longitudinal tensile stress uni-axial yield strength (horizontal axis). Negative numbers on the horizontal axis represent axial compressive stress.
The typical line-pipe material exhibits an elliptical yield-strength relationship for various combinations of biaxial stress.5 As shown in Fig. 3, this results in yielding at a higher value of circumferential tensile stress to uni-axial yield strength ratios than 1.0.
In tests of pressurized pipes, the ratio for a buried pipeline (longitudinal tensile stress to circumferential tensile stress ratio of 0.3) was found to be about 1.09.6
Therefore, this effect also suppresses yielding in a hydrostatic test of a pipeline to a pressure level exceeding 100% SMYS.
To resolve how much yielding actually takes place, Texas Eastern designed a gauging pig in the mid-1960s to measure diametric expansion.5
In 300 miles of 30-in. OD X-52 pipe, tested to a maximum of 113% SMYS, the company found only 100 joints of pipe (out of 40,000) that had expanded as much as 1.0%.
In 66 miles of 36-in. OD X-60 pipe tested to a maximum of 113% SMYS, the company found 100 joints of pipe (out of 6,600) that had expanded as much as 1.0%, still not a lot of expanded pipe.
Pressure-volume plots
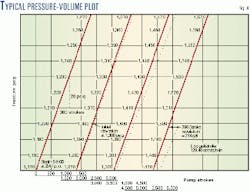
Fig. 4 shows a pressure-vs.-pump-stroke plot of an actual hydrostatic test. Recording the number of pump strokes of a positive displacement pump as each 10-psig increase of pressure is attained creates the plot.
Before plotting, it is prudent to hold the test section at a constant pressure to ensure there are no leaks. After it is established that there is no leak, the plot should be started at a pressure level no higher than 90% SMYS for the low elevation point in the test section in order to establish the "elastic" slope of the plot.
Projecting the elastic slope lines across the plot as shown allows the recording of pump strokes and comparison of the evolving plot to those slopes. If and when the actual plot begins to deviate from the elastic slope, either some pipe is beginning to yield or a leak has developed.
The pressurization can be continued in any event until the "double-the-strokes" point is reached. This is the point at which it takes twice as many strokes to increase the pressure by 10 psi as it did in the elastic range. Also, we suggest stopping at 110% SMYS if that level of pressure is reached before the double-the-stroke point.
Once the desired level has been reached, a hold period of 30 min should establish whether or not a leak has developed. Some yielding can be taking place while holding at the maximum pressure. Yielding will cease upon repeated repressurization to the maximum pressure, whereas a leak likely will not.
Testing an existing pipeline to a level at which yielding can occur may or may not be a good idea. It depends on the number and severity of defects in the pipe, the purpose of the test, and the level of maximum operating pressure that is desired.
More will be said about this presently.
Finally, on the subject of testing to actual yield, the following statements apply:
- Yielding does not hurt or damage sound pipe. If it did, no one would be able to make cold-expanded pipe or to cold-bend pipe.
- Yielding does not damage the coating. If it did, one could not field-bend coated pipe or lay coated pipe from a reel barge.
- Very little pipe actually undergoes yielding in a test to 110% SMYS.
- Those joints that do yield do not affect pipeline integrity, and the amount of yielding is small.
- The only thing testing in excess of 100% SMYS may do is to void a manufacturer's warranty to replace test breaks-if such a warranty exists.
In-service lines
Testing of an existing pipeline is a possible way to demonstrate or revalidate its serviceability. For a variety of reasons, retesting of an existing pipeline is not necessarily the best means to achieve confidence in its serviceability, however.
First, a pipeline operator who elects to retest a pipeline must take it out of service and purge it of product. The downtime represents a loss of revenue and a disruption to shippers.
Second, the operator must obtain test water. To fill 30 miles of a 16-in. pipeline, an operator would need nearly 40,000 bbl of water, equivalent to a 100 x 100-ft pond, 22 ft in depth. For 30 miles of 36-in. pipe, the volume required would be five times as large.
After the test, the water is considered a hazardous material because of being contaminated with product remaining in the pipeline. And, a test break, if one occurs, releases contaminated water into the environment. Aside from these issues, some problematic technical considerations exist.
The most important reason that a hydrostatic test may not be the best way to validate the integrity of an existing pipeline is that in-line inspection is often a better alternative. From the standpoint of corrosion-caused metal loss, this is most certainly the case. Even with the standard resolution tools that first emerged in the late 1960s and 1970s, this was true.
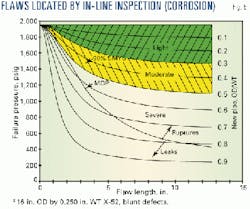
Fig. 5 shows the relative comparison between using a standard resolution in-line tool and testing a pipeline to 90% SMYS. The assumption is made in this case that the operator excavates and examines all "severe" and "moderate" anomalies identified by the tool, leaving only the "lights" unexcavated.
In terms of the 1970s technology, "light," "moderate," and "severe" meant the following:
- Light indications: metal loss having a depth less than or equal to 30% WT.
- Moderate indication: metal loss having a depth more than 30% WT but less than 50% WT.
- Severe indication: metal loss having a depth more than 50% WT.
In Fig. 5, the boundary between light and moderate is nearly at the same level of failure pressure as the 90% SMYS test for long defects, and it is well more than that level for short defects.
Because even the standard resolution tools have some defect length indicating capability, an in-line inspection on the basis represented in Fig. 5 gives a better assurance of pipeline integrity than a hydrostatic test to 90% SMYS.
With the advent of high-resolution tools, the advantage shifts dramatically in favor of using in-line inspection instead of hydrostatic testing to validate the serviceability of a pipeline affected by corrosion-caused metal loss.
From the standpoint of other types of defects, the appropriate in-line-inspection technology is evolving rapidly and, in some cases, it has proven to be more effective than hydrostatic testing. One example is the use of the elastic-wave tool for detecting seam-weld defects in submerged-arc-welded (SAW) pipe.7
Another is the use of transverse-field magnetic-flux-leakage (MFL) inspection to find seam anomalies along side or in the seams of electric-resistance-welded (ERW) pipe.8
In these cases, the particular tools revealed defects that were too small to have been found by a hydrostatic test to any reasonable level up to and including 110% SMYS. When a tool has established this kind of track record, a pipeline operator can justify using the tool instead of hydrostatic testing.
The concept of using in-line tools to detect flaws invariably raises the question about defects possibly not being detected. The reasonable answer is that the probability of non-detection is small (acceptably small, in our opinion) but not zero.
In the same context, one must also recognize that hydrostatic testing is not foolproof either. One issue with hydrostatic testing is the possibility of a pressure reversal. That possibility is discussed presently.
The other issue is that because hydrostatic testing can leave behind defects that could be detected by in-line inspection, the use of hydrostatic testing often demonstrates serviceability for only a short period of time if a defect-growth mechanism exists.
This possibility is discussed in the conclusion of this series.
Reversals
A pressure reversal is the occurrence of a failure of a defect at a pressure level that is less than the pressure level that the defect has previously survived due to defect growth produced by the previous higher pressurization and possible subsequent damage upon depressurization.
Pressure reversals were observed long before their probable cause was identified.3 The pipeline industry supported a considerable amount of research to determine the causes of pressure reversals.
The most complete body of industry research on this subject is NG-18 Report No. 111.4
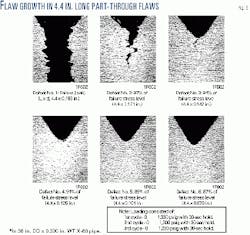
Fig. 6, taken from NG-18 Report No. 111, reveals the nature of experiments used to create and demonstrate pressure reversals. It shows photographs of highly magnified cross sections of the tips of six longitudinally oriented flaws that had been machined into a single piece of 36-in. OD by 0.390 in. WT X-60 pipe.
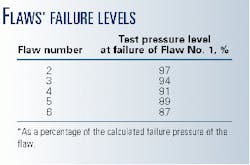
Each flaw had the same length, but each was of a different depth giving a graduation in severities. When the single specimen containing all six flaws was pressurized to failure, the deepest flaw (No. 1) failed.
By calculations based on their lengths and depths, the surviving flaws were believed to have been pressurized to the percentages of their failure pressures shown in the accompanying box.
As one can see, the tips of Flaw Nos. 2, 3, and 4 exhibit some crack extension as a result of the pressurization to failure. The nearer the defect to failure, the more crack extension it exhibited.
In fact, due to its extension during the test, Flaw No. 2 is now deeper than Flaw No. 1 was at the outset. Logic suggests that if we could have pressurized the specimen again, Flaw No. 2 would have failed at a level less than that which it experienced during the testing of Flaw No. 1 to failure. Indeed, in similar specimens designed in a manner to allow subsequent pressurizations, that is exactly what often occurred.
This type of testing led to an understanding of pressure reversals in terms of ductile-crack extension occurring at near-failure pressure levels where the amount of crack extension is so great that crack closure upon depressurization does further damage leading to the inability of the flaw to endure a second pressurization to the previous level. The pressure reversal is expressed as a percentage.
Pressure reversal = (original pressure minus failure pressure) divided by (original pressure times 100).
Once the cause was known, the next key question was: What is the implication of the potential for pressure reversals on confidence in the safety margin demonstrated by a hydrostatic test?
This question has been answered in particular circumstances and the answer comes from numerous examples of actual hydrostatic tests. In actual hydrostatic tests, direct evidence that pressure reversals result from the type of flaw growth shown in Fig. 6 has seldom been obtained. A few such cases have been documented, however, and it is assumed that defect growth is responsible for all such cases.
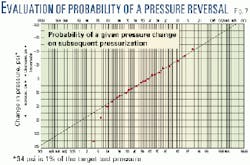
Fig. 7 is an example of an analysis of pressure reversals in a specific test. This figure is a plot of sizes of pressure increases or decreases (reversals) on subsequent pressurizations vs. the frequency of occurrence of that size of increase or decrease.
Among other things, these data show that upon pressurization to the target test-pressure level, a 1% pressure reversal (34 psi) can be expected about once in every 15 pressurizations, a 2% pressure reversal (68 psi) can be expected about once in every 100 pressurizations, and a 3% pressure reversal (102 psi) can be expected about once in every 1,000 pressurizations.
For a target test pressure level of 1.25 times the MOP, the expectation of a 20% pressure reversal (enough to cause failure at the MOP) is off the chart: that is, it is an extremely low probability (but not impossible).
There have been a handful of pipeline service failures in which a pressure reversal is the suspected but unproven cause. There is also one case of a large pressure reversal (62%) that was unequivocally demonstrated because it occurred on the fifth cycle of a five-cycle hydrostatic test.4
It should be noted that most of the experiences of numerous and large pressure reversals in actual hydrostatic tests have involved flaws associated with manufacturing defects in or near ERW seams, particularly in materials with low-frequency welded (generally pre-1970) ERW pipe. But in most cases in which numerous reversals occurred, the sizes of the actual pressure reversals observed are small (less than 5%).
One thing seems clear: If a hydrostatic test can be successfully accomplished without the failure of any defect, the likelihood of a pressure reversal will be extremely small.
It is the tests in which numerous failures occur that have the highest probabilities of reversals. And, when the number of reversals becomes large, the probability of a reversal of a given size can be estimated, as was done on the basis of Fig. 7
Practical considerations
For new pipeline materials made to adequate specifications with adequate inspection and pipe-mill testing, one does not expect test failures even at pressure levels corresponding to 100% or more of SMYS. Therefore, there is no reason not to test a pipeline constructed of such materials to levels in excess of 100% SMYS.
As has been shown, the higher the ratio of test pressure to operating pressure, the more confidence one can have in the serviceability of a pipeline.
In the case of existing pipelines, especially the older ones, such test levels may be impossible to achieve. And if numerous test failures occur, the margin of confidence may erode because of the potential for pressure reversals.
Weighing against low test-pressure-to-operating-pressure ratios, on the other hand, is the fact that such tests, by definition, generate lower levels of confidence and buy less time between retests if the issue of concern is time-dependent defect growth. Some possible responses to this dilemma follow.
First and foremost, as has already been mentioned, the use of an appropriate in-line-inspection tool is always to be preferred to hydrostatic testing if there is sufficient confidence in the ability of the tool to find the defects of significance.
Most of the pipe in a pipeline is usually sound. Therefore, it makes sense to use a technique that will find the critical defects and allow their repair as opposed to testing the entire pipeline when it is unnecessary.
The industry now has access to highly reliable tools for dealing with corrosion-caused metal loss, and tools are evolving rapidly to detect and characterize cracks. As has been noted, some uses of these tools have already proven their value and, in those cases, their use in lieu of hydrostatic testing makes good sense.
There are still certain pipelines for which hydrostatic testing remains the best (in some cases, the only) means to revalidate their serviceability. In those cases, the following advice may be useful:
- Determine the mill's hydrostatic test level for the pipe. The mill-test certificates will show the level applied if such certificates can be found. Also, search the records for prior hydrostatic tests at or after the time of construction.
- Review the pressure levels and causes of mill-test or in-place test failures if they exist. If none of these records is available, look up the API 5L specification applicable to the time the pipe was manufactured. This will reveal the standard mill-test pressure for the pipe.
- Do not assume, if you do not know, that the pipe was tested in the mill to 90% SMYS. This was not always the case especially for non-X grades and smaller diameter pipe materials.
- If you decide to test the pipe to a level in excess of its mill-test pressure for the first time ever, anticipate test failures. If you cannot tolerate test failures, consider testing to a level just below the mill-test pressure. This may mean, of course, that the MOP you validate is less than 72% SMYS. (The minimum test pressure must be at least 1.25 times the MOP for 4 hr plus 1.10 times MOP for 4 hr for a buried pipeline; see CFR Part 195.)
Alternatively, if you can tolerate at least one test failure, pressurize to a level as high as you wish or until the first failure, whichever comes first. If you then conduct your 1.25 times MOP test at a level at least 5% below the level of the first failure, a second failure will be highly improbable.
- It is always a good idea to conduct an integrity test as a "spike" test. This concept has been known for many years,4 but more recently it has been advocated for dealing with stress-corrosion cracking.10 The idea is to test to as high a pressure level as possible but to hold it for only a short time (5 min is adequate).
Then, if you can live with the resulting MOP, conduct your 8-hr test at a level of at least 5% below the spike-test level. The spike test establishes the effective test-pressure-to-operating-pressure ratio; the rest of the test is only for the purpose of checking for leaks and for meeting the requirements of Part 195.
References
- Bergman, S.A., "Why Not Higher Operating Pressures for Lines Tested to 90% SMYS?" Pipeline and Gas Journal, December 1974.
- Kiefner, J.F., Maxey, W.A., Eiber, R.J., and Duffy, A.R., "Failure Stress Levels of Flaws in Pressurized Cylinders," Progress in Flaw Growth and Toughness Testing, ASTM STP 536, American Society for Testing and Materials, pp. 461-481 (1973).
- Brooks, L.E., "High-Pressure Testing: Pipeline Defect Behavior and Pressure Reversals,"ASME, 68-PET-24 (1968).
- Kiefner, J.F., Maxey, W.A., and Eiber, R.J., "A Study of the Causes of Failure of Defects That Have Survived a Prior Hydrostatic Test," Pipeline Research Committee, American Gas Association, NG-18 Report No. 111 (Nov. 3, 1980).
- Duffy, A.R., McClure, G.M., Maxey, W.A., and Atterbury, T.J., "Study of Feasibility of Basing Natural Gas Pipeline Operating Pressure on Hydrostatic Test Pressure," American Gas Association, Inc. Catalogue No. L30050 (February 1968).
- Maxey, W.A., Podlasak, R.J., Kiefner, J.F., and Duffy, A.R., "Measuring the Yield Strength of Pipe in the Mill Expander," Research report to AGA/PRC, AGA Catalog No L22273 (December 1973).
- Maxey, W.A., Mesloh, R.E., and Kiefner, J.F., "Use of the Elastic Wave Tool to Locate Cracks Along the DSAW Seam Welds in a 32-in. (812.8 mm) OD Products Pipeline," International Pipeline Conference, Vol. 1, ASME (1998).
- Grimes, K., "A Breakthrough in the Detection of Long Seam Weld Defects in Steel Pipelines," 1998; available from Pipeline Integrity International.
- Kiefner, J.F., and Maxey, W.A., "Periodic Hydrostatic Testing or In-line Inspection to Prevent Failures from Pressure-Cycle-Induced Fatigue," presented to API Annual Pipeline Conference & Cybernetics Symposium, New Orleans, Apr. 18-20, 2000.
- Leis, B.N., and Brust, F.W., "Hydrotest Strategies for Gas Transmission Pipelines Based on Ductile-Flaw-Growth Considerations," AGA Pipeline Research Committee, NG-18 Report No. 194, July 27, 1992.
The authors-

John F. Kiefner is president of Kiefner & Associates Inc., Worthington, Ohio, which he founded in 1990. For 33 years, he has specialized in research on pipeline material behavior and pipeline defects and repair methods.
Kiefner holds BS and MS degrees in civil engineering from Purdue University and a PhD from the University of Illinois. He is a registered professional engineer in Ohio and a member of ASME and NACE.

Willard A. Maxey joined Kiefner & Associates in 1992 after 32 years with Battelle Memorial Institute, Columbus, Ohio. For much of his career, he has investigated fracture initiation, propagation, and arrest in pipelines and cylindrical pressure vessels. He holds a BS in geophysical engineering from the Colorado School of Mines.