Radar-mapped hydrocarbon seepage anomalies borne out by drilling in Wharton County, Tex.
Even a limited data set, such as the one described here involving studies in Wharton County, Tex., supports the published body of literature that radar mapping of hydrocarbon seepage has a role in oil and gas exploration.
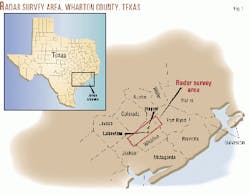
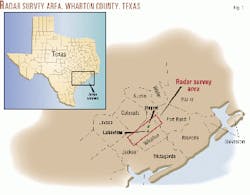
The author since the mid-1990s has been reviewing an extensive radar survey flown in 1992 over the northern part of Wharton County (Fig. 1) in an area where the production varies from very shallow to very deep in Miocene sands to Oligocene Frio to Eocene Yegua to Eocene Wilcox.
Background on radar
In 1996 the author of this article and Merrill I. Skolnik reviewed the science that supports the use of radar to map seepage in the atmosphere above subsurface hydrocarbon accumulations.1 2
Skolnik and Bailey in 1997 presented a more extensive paper on the subject at the Fifth Conference on Emerging Technologies: Unconventional Methods in Exploration for Petroleum and Natural Gas3 sponsored by the Southern Methodist University Institute for the Study of Earth and Man.
Since these papers the first author has been reviewing the Wharton County area. The initial Wharton radar survey revealed 43 seepage anomalies. Twenty-two anomalies were associated with producing fields; 21 did not have production and were designated "untested" seepage anomalies.
Beginning in 1993 and continuing through 1998 the area was periodically resurveyed
- To determine if changes took place in "untested" anomalies with time and season;
- To record changes in anomalies over producing fields as they were produced; and
- To determine the effect of season and agriculture on mapping of seepage.
Some of the radar anomalies associated with producing fields indicated additional development locations. A few have had additional development drilling confirming the fields were larger as mapped by radar. These will be presented in a future publication.
Other producing fields from mapping had evidence of deeper untested hydrocarbon accumulations. As yet none of these has been drilled.
This brings us to the "untested" seepage anomalies. So far only three of the 21 "untested" seepage anomalies have been drilled by industry. The three were called Heyne (Fig. 1), Heyne SW, and Lakeview (Fig. 1). These are reviewed in this article.
Wharton County anomalies
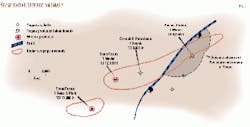
Heyne (Fig. 2) is an elongate, southwest-northeast striking seepage-anomaly. It covers 700 acres. Heyne is a moderate-level intensity seepage anomaly.
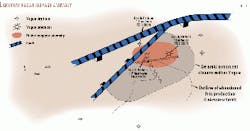
The Lakeview anomaly (Fig. 3) is ovate and encompasses 200 acres. Lakeview is also a moderate-level seepage anomaly.
An abandoned Miocene gas field overlaps a portion of Lakeview. The anomaly is not affected by the abandoned field. For a discussion of radar-seepage intensities see the previous Oil & Gas Journal articles.1,2
The Wharton area was chosen to survey because it was thought to be a mature area that could be used to calibrate radar-seepage mapping. Because the original survey revealed so many untested seepage anomalies, a number of them were assessed with a direct detection method to confirm hydrocarbons in the soil at the ground surface. MOST (Microbial Oil Survey Technique) was used to do this.
Both Heyne and Lakeview were sampled. Samples were randomly collected at the surface within and outside both anomalies. The samples were processed by Geo-Microbial Technologies, Ochelata, Okla.
The soil samples confirmed the presence of hydrocarbons in the soil. These results lent credence to the radar anomalies.
The next step was to determine if there was evidence of subsurface traps, structural or stratigraphic. Heyne and Lakeview by their shape looked to be structural. Well control was inadequate to determine if traps were present at either. The only seismic the author had access to were Yegua maps.
At Heyne the seismic map at the Nodosaria mexicana level revealed a low relief closure against a fault on the downthrown side (Fig. 2). The upthrown side of the fault showed no closure.
The seepage anomaly bore no relation to the Yegua structure, and located within the seepage anomaly was a Yegua dry hole, the No. 1 Vacek. It was present at the time of surveying.
Near the location of the fault at Nod mex the seepage anomaly changed and was narrower east of the fault. The author would interpret this as a down dropping of the same structure as west of the fault.
Assuming one trap with a common water table, the down-dropped side has less closure above water. If this is true the fault at Nod mex has to be projected to a deeper horizon.
Since the seepage anomaly did not conform to the Yegua structure and a dry Yegua well was within the seepage anomaly it was interpreted that the hydrocarbon accumulation was deeper.
At Lakeview a Yegua seismic map indicated a structure cut by faults on the NW and NE sides (Fig. 3). In addition seismic lines had been processed for hydrocarbon indicators and marked on the map. These indicated the presence of "HCIs" in the Yegua on crossing seismic lines in the area of the seepage anomaly.
The radar-seepage anomaly, albeit smaller than area of closure, conformed to structural closure unlike at Heyne. The interpretation was that this anomaly was created by a Yegua hydrocarbon accumulation.
The anomaly called Heyne SW (Fig. 2) because of its limited size did not have MOST sampling nor was the structure examined.
Related drilling
In 1994 Padon Oil drilled the No. 1 Maerz to 8,050 ft to presumably test the Yegua structure mapped at Heyne (Fig. 2). The well was located outside of the seepage anomaly but well within the seismically-mapped Yegua closure. No completion was attempted.
In 1995 Pecos Petroleum re-entered the Padon 1 Maerz well and completed it for 2 MMcfd of gas and 28 b/d of condensate in the Yegua. The well produced for a while and then was abandoned. The Padon well went stratigraphically as deep as the dry 1 Vacek well.
In 1998 TransTexas drilled the 1 Noska to Wilcox on the southwestern end of Heyne. This well was completed for 4.2 MMcfd and 290 b/d of condensate in the Wilcox.
TransTexas also drilled the Heyne SW seepage anomaly (Fig. 2). The TransTexas 1 Rees-Gifford was completed in the Wilcox for 7.5 MMcfd plus 284 b/d of condensate. Clearly the Heyne and Heyne SW seepage anomalies reflect Wilcox accumulations, not Yegua. At Heyne there are untested locations in the anomaly that should be productive.
Lakeview was drilled in 1996 by Cox & Perkins to 8,800 ft to test the Yegua (Fig. 3). The 1 Lutringer well was completed in the Yegua for 2.2 MMcfd and 33 b/d of condensate.
Cox & Perkins subsequently completed a successful development well, 1 Priesmeyer, for 2.2 MMcfd and 25 b/d of condensate. Both of these wells were within the radar seepage anomaly. They drilled a third well, 1 Drastrata, just outside the anomaly to the northwest. It was dry.
The radar appears to have precisely mapped the Yegua accumulation (Fig. 3) within the overall Yegua closure.
What it all shows
All three anomalies, the only "untested" anomalies drilled so far, were productive: Heyne and Heyne SW in the Wilcox and Lakeview in the Yegua.
At Lakeview the radar accurately mapped the extent of hydrocarbons within the structural closure. Not knowing what the Wilcox seismic structure maps looked like at Heyne and Heyne SW it may be true for them, too, since no additional wells have been drilled outside or adjacent to the anomalies that the author is aware of.
In all three cases having a radar survey would have saved on the need for seismic and provided more accurate risk-economic calculations.
These three anomalies and their drilling provide information about seepage in Wharton. That the Yegua and Wilcox create anomalies in the atmosphere indicates that both of these horizons are seeping from the subsurface, deep subsurface more than 12,000 ft in the case of the Wilcox, to the ground surface.
To the contrary the author found no evidence the shallower Oligocene Frio is seeping. Frio fields did not appear as anomalies in the original survey as Yegua and Wilcox fields did.
One could argue that these Frio fields were old, lower pressure to start with, and may have been nearly produced out thus any seepage was too weak to see at the time of the survey in 1992. But in the survey area a number of Frio discoveries were made after the survey, and none had radar anomalies. Does the Frio not seep, or is seepage intensity just too low from the Frio for radar?
Lastly, as evidenced by Lakeview, Heyne, and Heyne SW, seepage is vertical, straight vertical, as has previously been put forward in the literature. All the producing wells lie within the surface seepage anomaly. The producing area in the subsurface is thus directly under the surface seepage anomaly.
References
- Bailey, Thomas C., and Skolnik, Merrill I., "Science behind sensing hydrocarbon seepage using x-band radar," OGJ, Dec. 2, 1996, pp. 85-88.
- Bailey, Thomas, "Application of x-band radar to sense hydrocarbon seepage," OGJ, Dec. 9, 1996, pp. 72-75.
- Skolnik, Merrill I., and Bailey, Thomas C., "A review of radar for the detection of gas seepage associated with underground oil and gas deposits," in proceedings of Applications of Emerging Technologies Unconventional Methods in Exploration for Petroleum and Natural Gas V(Dallas), Southern Methodist University, Oct. 30-31, 1997, pp. 207-28.
The author-
Thomas C. Bailey was employed with Amoco Production Co. during 1968-92, where he served in various technical and management positions in and outside the US. Prior to his departure he chaired Amoco's Surface Prospecting Task Force, which investigated microseepage exploration tools and methods. He has a BS degree in geochemistry and an MA in geology from Bowling Green State University. E-mail:[email protected]


