Multicomponent induction technology helps resolve enhanced, low resistivity reservoirs
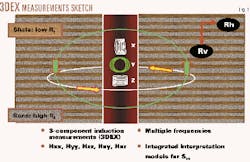
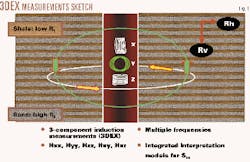
This article describes a service that provides additional resistivity measurements to survey the formation in three dimensions (Fig. 1). This breakthrough in induction logging technology complements current openhole logging capabilities and provides a more accurate and robust reservoir description of low resistivity, low contrast shaly sand pay zones in particular.
Shell Technology EP and the Houston Technology Center of Baker Hughes have jointly developed and field-tested this multicomponent induction instrument.
Explorationists are increasingly challenged to find economic prospects in difficult frontier regions with complex geological environments. Frequently, economic hydrocarbon reserves exist within these frontier plays as current drilling activity indicates. However, the subsequent evaluation of these exploration wells to identify net pay and determine the reserve potential is problematic with traditional petrophysical methods.
One such significant challenge is to evaluate low resistivity, low contrast shaly sand reservoirs. These exploration targets are easily overlooked and are commonly undervalued using existing prospecting models based on conventional induction logs and formation evaluation methods.
According to a recent paper published in the AAPG Bulletin, about 30% of the world's estimated hydrocarbon reserves are contained in these shaly sand formations. The significance of this problem prompted the development of the 3D Explorer (trademark), or 3DEX (trademark) instrument, a multicomponent, induction logging tool.
Worldwide exploration and delineation drilling activity in 1999 was estimated at 7,433 wells (OGJ, Feb. 28, 2000, p. 56). This high level of drilling activity suggests the E&P industry can reap significant benefits from this new resistivity measurement technology.
The information provided by this service will enhance the oil and gas professional's knowledge of the reservoir characteristics and reserve potential, placing oil companies and independent operators in a better position to maximize reserve value.
Integration of 3DEX data with geophysical, geological, and traditional log data used in exploration and reservoir interpretation studies will likely reveal many new prospect and redevelopment opportunities in most onshore and offshore basins. Applications for this new technology are present in today's major exploration plays, including the deepwater exploration wells of the Gulf of Mexico, West Africa, the North Sea, and offshore Brazil.
Limitations associated with existing resistivity instruments compromise the evaluation of low resistivity pay for several reasons. Previous induction instrument designs limit the measurements to one dimension because the transmitter-receiver sensors are aligned along the tool axis.
Especially in vertical and low deviation wells conventional induction instrument design significantly biases the resistivity measurement to the very low resistivity shale component of the thin-bedded, laminated sand-shale sequences. This frequently leads to the underestimation of oil saturation in those formations. Traditionally, empirically based 'bulk shale' petrophysical models are inaccurate because they do not specifically separate the laminar shale effects from the interlayered laminar sand porosity and saturation properties.
When these laminated sands are properly characterized, the true net pay and reservoir production potential can be accurately predicted and the overall economic field development enhanced. In summary, the reserve potential of low resistivity, low contrast shaly sand pay zones has typically been underestimated.
Enhanced petrophysical evaluation models and methods have been developed and tested using 3DEX field test data, which include the horizontal and vertical resistivity provided by 3DEX, to obtain a more accurate shaly sand reservoir description model. The 3DEX technology addresses the hydrocarbon saturation evaluation of thin-bedded, laminar shaly sands and improves their productivity estimation. Integrated interpretation of data sets, including 3DEX, NMR, conventional porosity, and resistivity data, significantly improve the accuracy and robustness of reservoir hydrocarbon reserve estimates, reservoir description, and simulation results while minimizing the possibility of bypassed pay.
Instrument measurements
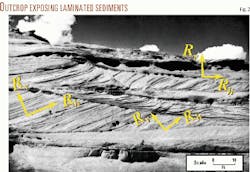
Many geologic formations exhibit resistivity anisotropy, which is simply a variation in resistivity measurement with direction (Fig. 2). Fig. 1 illustrates the 3DEX instrument sketch in a vertical well containing a laminated sand-shale sequence that exhibits resistivity anisotropy.
In exploration wells, which are often drilled vertically or close to vertically, hydrocarbon bearing sand-shale formations may often be overlooked or underestimated due to the high conductivity (low resistivity) of the shale and resulting in a very low contrast, low formation resistivity measurement using conventional logs. To overcome this problem, the 3DEX multicomponent induction instrument collects additional data.
Conventional openhole induction logging tools are composed of transmitter and receiver sensors with their axes aligned parallel to the tool and borehole axis (Fig. 1). If the apparent formation dip is small, conventional tools induce survey currents in the adjacent formation that flow primarily parallel to the bedding planes. The currents will be most concentrated in the highly conductive beds, which are typically the shales in a hydrocarbon section. As a result of this induced current flow pattern, the horizontal resistivity is heavily biased towards the low resistivity (conductive) shales and is insensitive to the hydrocarbon-bearing sand resistivity.
Horizontally mounted coil arrays (XX and YY) as utilized in the 3DEX instrument are instead aligned with their axes perpendicular to the tool and borehole axis to additionally resolve the vertical resistivity (Fig. 1). These arrays induce currents that flow primarily across the laminated sand-shale sequences and are far more sensitive to the hydrocarbon-bearing sand resistivity. A vertical and horizontal resistivity value is obtained by processing the direct measurements obtained from the multicomponent coil arrays.
Geological environments
Electrical anisotropy occurs when a formation's resistivity varies with direction. An illustration of these laminated sediments is shown in the outcrop photograph (Fig. 2), where the vertical and horizontal resistivity orientation, as referenced to the geologic bedding structures (cross bedding), is marked.
The horizontal resistivity is measured along (parallel to) the bedding plane. As Fig. 2 indicates, the vertical and horizontal resistivity orientation changes with the bedding dip and strike from one location to another in the formation.
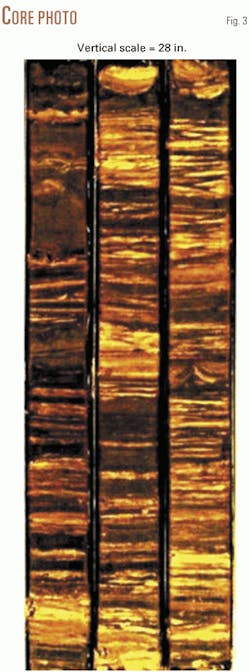
The 3DEX data and detailed petrophysical analysis can improve the accuracy of hydrocarbon saturation analysis in two important types of low resistivity pay that exhibit electrical anisotropy. The first is formed by thin-bedded, laminated sand-shale sequences (Fig. 3). The second form of low resistivity pay is caused by sand layers with systematically varying grain size that can create an electrical anisotropy due to variations in water saturation and distribution of electrically nonconductive hydrocarbons.
Low resistivity pay is a common term encompassing many forms of shaly sands. Low contrast pay, on the other hand, implies by definition two separate components or lithologies that are almost indistinguishable from one another when using conventional resistivity data. In this case, highly conductive shales and low conductivity pay sands occur as thin-bedded or 'laminated' sequences. Thinly layered sands and shales that are below the vertical resolution of traditional induction logging tools occur in many depositional environments.
Such a lithology is common in moderate to low-energy fluvial sequences, which include upper point bar, levee and crevasse splay sands, and silty sands. Laminated shales and thin flasher-bedded, sand-shale sequences commonly occur in subaqueous prograding deltas, tidal-estuarian deltas, and shelf sands.
Turbidites span a large spectrum of depositional energy environments. Thin-bedded, laminar sands and shales are common in the channel levee and overbank levee environment and the middle to distal fan complexes. These thin bedded sequences play a significant role in the overall 'net pay' contributions of most deepwater plays.
The highly productive sheet sands and interbedded shales of the middle and outer turbidite fan are highly productive and hydraulically well connected. When they occur with sufficient thickness, a single wellbore can drain large areas and sustain extremely high flow rates.
Turbidite overbank and channel levee sands are more erratic in thickness and areal extent but are still significant exploration targets in many basins. These sands may also be hydraulically well connected both laterally and vertically due to their cross-cutting or cut-and-fill relationship. Seemingly poorly developed low resistivity pay intervals within a wellbore will commonly produce at unexpectedly high rates due to the well connected hydraulic network with adjacent sands.
Benefits, improved evaluation
The Archie water saturation equation published in 1942 established the cornerstone for petrophysical interpretation. This equation is most suitable for reservoirs containing thick hydrocarbon producing sands that are shale free. Higher rock formation resistivity measurements relate to higher hydrocarbon saturation within the rock pore space.
Today, petrophysicists are confronted with the challenge of evaluating ever more complicated reservoirs. Numerous traditional shaly sand petrophysical models, most of which are empirical derivatives of Archie's original equation, exist today. This has contributed to inconsistency and uncertainty in the application of these models to complex reservoir evaluation problems encountered in low resistivity, low contrast pay formations.
Therefore, these empirical formation evaluation models are not suitable for reserve determination where the highest possible accuracy is required in costly developments such as deepwater. Petrophysical analysis based on empirically derived effective porosity, effective saturation models may result in an underestimation of hydrocarbon reserves and production performance by as much as 40%.
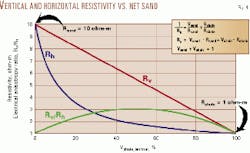
For a laminated sand-shale sequence in a vertical well as shown in Fig. 1, the macroscopic vertical and horizontal resistivities (Rv, Rh, respectively) are shown on the y axis as a function of the laminar shale volume (Vsh) on the x axis (Fig. 4). The maximum ratio between the vertical and horizontal resistivity occurs at the 50% laminar shale volume point, where the electrical anisotropy reaches its highest point.
As the laminar shale increases from 0% to 30%, the horizontal resistivity decreases rapidly. For laminar shale volumes greater than 30%, the horizontal resistivity exhibits low sensitivity to changes in shale volume.
The vertical resistivity, however, is a volume weighted average of the sand and shale resistivity components and shows a much more gradual reduction as the laminar shale volume increases (Fig. 4). The vertical resistivity and, most importantly, the anisotropy ratio is sensitive to changes in laminar shale content throughout the entire range from 0% to 100% shale volume.
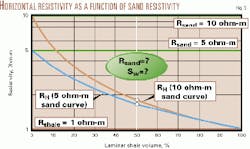
The limitations of horizontal resistivity sensitivity are better illustrated in Fig. 5. For a laminated sand shale sequence model, shown in Fig. 1, with a 1 ohm-m shale resistivity, the horizontal resistivity is calculated versus the laminar shale volume for two values of laminar sand resistivity, 5 and 10 ohm-m.
Utilizing the horizontal resistivity alone, these two sand-shale sequences would be virtually indistinguishable at a 50% laminar shale volume with only a 0.16 ohm-m difference in horizontal resistivity. Under similar conditions the vertical resistivity changes by 2.5 ohm-m.
The utilization of vertical resistivity greatly improves the resolution of laminar shale content and laminar sand resistivity. More robust petrophysical evaluation models are now available to isolate the laminar shale effects utilizing the electrical anisotropy measurements (Rh and Rv) provided by the 3DEX data.
Well evaluation, net pay count
The utilization of horizontal and vertical resistivity in the proper formation evaluation model provided by the 3DEX instrument results in an improved reservoir characterization of the productive laminar sand porosity and water saturation. The saturation evaluation model accurately quantifies both laminar and dispersed shale effects when they occur in combination by taking advantage of electrical macroscopic anisotropy derived from the 3DEX induction instrument.
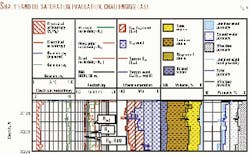
Fig. 6 shows the petrophysical analysis results using 3DEX field log data obtained from a nearly vertical well in a difficult shaly sand case with high laminar shale volume and low net to gross. These results demonstrate the advantages of including electrical anisotropy in the analysis.
Shaly sands that are predominately laminar with low dispersed shale content and electrical anisotropy exhibit conventional deep induction resistivity of a few ohm-meters' variation and are often capable of producing hydrocarbons at commercial rates. These zones can be detected reliably but cannot be evaluated accurately with conventional induction resistivity logs. The laminar sand water saturation can be 10% to 30% lower than the 'bulk formation' saturations obtained from the traditional methods. The 3DEX data (Rv and Rh) greatly improve the evaluation accuracy for this group of shaly sands.
The log example (Fig. 6, X169-X220 ft) has a high shale content and moderate electrical anisotropy. The conventional deep induction resistivity data (HDIL), shown in track 2, cannot effectively identify this interval as a potentially productive sand-shale sequence. The 3DEX data (Rv and Rh) are required to improve the petrophysical evaluation accuracy of this zone and properly identify it as a finely laminated sand-shale interval. These zones cannot be detected reliably nor evaluated accurately with conventional induction resistivity logs.
This log example (Fig. 6, X169-X220 ft) represents the most interesting and challenging shaly sand analysis. Typical shale resistivity anisotropy values measured in this well were included in this analysis. Total shale volume is 60% to 70%, but the separation of the 3DEX Rh and Rv curves, together with the resulting anisotropy ratio, indicate that they are almost entirely laminar and thin-bedded in nature, analogous to the core photos (Fig. 3), with an average net to gross of 35%.
The laminar sand water saturation analysis of 40% to 55% agrees well with the water saturation to adjacent sands of moderate to low quality. Throughout this interval the horizontal 3DEX resistivity curve is consistent with the deep induction (HDIL) resistivity. The hydrocarbon saturation indicates that this interval contains potential laminar sand pay and could produce gas at economic rates, resulting in approximately 18 ft of additional net pay. This interval may not have been included in the initial net pay count based on the standard water saturation analysis utilizing conventional induction resistivity data.
Interpretation of 3DEX field measurements in shaly zones indicates that the utilization of Rh and Rv, resulting from macroscopic anisotropy and direct evaluation of the laminar sand fraction resistivity, Rsd, makes identification and quantification of low contrast, low net-to-gross pay much more reliable. Results of a separate test in another field support a significant increase in OOIP estimates, resulting in an economically attractive field redevelopment.
Benefits, limits of image data
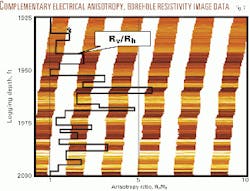
In order to provide quality control for geological changes in shale volume related to the electrical anisotropy ratio (Rv/Rh) obtained from the 3DEX multicomponent induction data, high-resolution borehole electrical image data were also acquired with the 'Simultaneous Acoustic and Resistivity Imager' (STAR) in a test well (Fig. 7).
The STAR resistivity button is 4 mm in diameter, and the typical spatial sampling rate of the STAR resistivity tool is 10 samples/in., thus giving a high-resolution resistivity image of the formation. The ratio of the 3DEX vertical to horizontal resistivity (electrical anisotropy ratio) is superimposed on the STAR borehole static resistivity image data (Fig. 7).
Fig. 7 shows the correlation between the STAR image and the electrical anisotropy ratio obtained from the 3DEX measurements. Visible thin layering features in the borehole image data correlate well with the 3DEX anisotropy ratio (i.e., Rv / Rh) at 1,940 and 1,960 ft, for example. This is an excellent example to demonstrate the good data interpretation correlation between two different instruments with two different types of resolution.
The STAR instrument offers a superior image resolution while the 3DEX instrument offers superior formation resistivity resolution. However, there are limitations in the borehole image data to resolve laminated formation parameters such as shale volume and the laminated sand true deep resistivity.
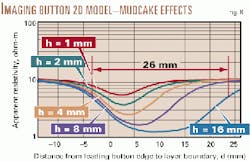
These limitations are illustrated in Fig. 8, which shows apparent resistivity modeling results for a 2D three-layer model of the image pad button resistivity for five shale lamination thicknesses (h) ranging from 1 through 16 mm. The shale lamination resistivity modeled is 1 ohm-m and the shoulder sand resistivity is 10 ohm-m. A 1 ohm-m mudcake layer with a 4-mm thickness was included in the 2D model.
Although the image pad is a 3D device, these 2D simulation results indicate that the button resistivity image data cannot accurately resolve the laminar component's resistivity and thickness under these conditions for lamination thicknesses below 16 mm. The image button resistivity modeling results in Fig. 8 also indicate that the laminar shale volume obtained from image data is considerably overestimated.
For example, in Fig. 8 the shale lamination thickness obtained for the 16-mm case shows an apparent thickness of 25 mm at the 50% threshold point of the image pad button resistivity data resulting in a 56% thickness error. In Fig. 7 image features are not readily visible in zones where 3DEX measured electrical anisotropy.
Borehole image data are critical in determining valuable structural geologic information but can only be used in a 'qualitative' manner for formation saturation evaluation. The image resolution data are sufficiently accurate to describe depositional sequence and geologic structure. Borehole image data utilization for Sw quantitative analysis in sand-shale laminated sequences can be impaired by limitations in its resolution, depth of investigation, and the adverse effects of drilling formation damage, mudcake, and borehole rugosity.
Petrophysical interpretation of 3DEX data provides valuable reservoir engineering information. Quantitative petrophysical evaluation including 3DEX electrical anisotropy results in improved Sw determination of the laminar sand fraction based on a deep measurement whose accuracy is not limited by lamination thickness and vertical distribution. The petrophysical evaluation of 3DEX field test data utilizing electrical anisotropy demonstrated a significant improvement in the match of the computed laminar sand fraction Sw's and lab-measured, capillary pressure saturation data. These field test evaluations demonstrated that macroscopic electrical anisotropy can be used to more reliably and accurately evaluate thin-bedded, laminar sand hydrocarbon saturation and producibility.
As an example, Fig. 8 illustrates how 3DEX (quantitative) and STAR (qualitative) data are complementary in determining net pay and hydrocarbon saturation and the benefits of model-based data integration interpretation. STAR image data can complement the 3DEX data interpretation by contributing to the 3DEX interpretation model, structure features that are below the 3DEX instrument's spatial resolution.
These 'anisotropy anomalies' can affect the 3DEX response and include such special cases as conductive faults, high resistivity 'tight' streaks such as thin limestones, and disrupted planar bedding from slumps or soft sediment flow associated with compaction and de-watering. Integrated data interpretation of 3DEX and STAR measurements allows effective removal of unwanted electrical anisotropy effects and improves reservoir characterization.
Exploration fiscal challenges
In most high cost frontier exploration plays, the economic success rate for new field discoveries must be kept well above 20%. New formation evaluation tools and tool suites together with the proper petrophysical methods can help to further improve field economics in areas ranging from exploration in marginally economical onshore regions to the capital intensive deepwater plays by identifying new or additional hydrocarbon pay intervals.
Deepwater exploration in particular is operationally complicated and has higher costs and risks associated with finding, developing, and producing hydrocarbon accumulations. As significant hydrocarbon discoveries are made in ever deeper offshore waters, the petroleum industry continues to meet the economic challenges posed for recovering these resources. The Gulf of Mexico, for example, is the most active deepwater region in the world in terms of the number of development projects. One tabulation lists 112 producing, planned, and prospective developments in the deepwater frontier (OGJ, May 1, 2000, p. 81).
Worldwide deepwater exploration and development activity has increased significantly during the last 10 years, reinforced by major discoveries in deep water (greater than 1,500 ft) with outstanding reservoir production performance. The deepwater exploration growth is made possible through innovative development and production techniques, and numerous deepwater field developments have recently been successfully brought to commercial production.
High, sustainable production rates from these reservoirs represent a positive investment outcome for oil companies. Accumulated production histories from deepwater reservoirs demonstrate how these reservoirs are economically viable development projects. Low resistivity deepwater turbidite pay sands (Fig. 3) represent a new exploration frontier in which 3DEX data will enhance reservoir delineation and reserves evaluation.
Benefits in maturing basins
The reality is most established hydrocarbon productive regions around the world are experiencing the maturing of their oil basins and have limited new exploration frontiers.
Over time, producing regions experience a steady decrease in the size of the new discoveries recorded during the course of exploration as the basins are repeatedly surveyed by existing prospecting and evaluation tools. The results reveal that most valid hydrocarbon producing leads in these basins have been drilled, unless new measurements are available with the ability to highlight previously bypassed hydrocarbon zones.
Thus, the previously developed producing infrastructure could be further utilized with significant economic benefits. Using the new measurements and interpretation methods available through 3DEX technology could extend the field production life by identifying additional reserves within these developed areas.
Acknowledgments
The new multicomponent induction logging tool was jointly developed and field tested by Baker Atlas and Shell Technology EP. We thank Shell Technology EP for their sponsoring and continuing support of this project. We also thank the various Shell operating groups for their kind permission to publish the logging data and examples. Thanks to Stephen Painchaud for the borehole resistivity image simulation data.
The authors
Otto Fanini has worked with Baker Atlas since 1992 developing state-of-the-art microresistivity, galvanic, and induction resistivity logging instruments. He worked in the semiconductor industry in 1982-86, in broadcast and communication from 1986-90, and instrumentation equipment from 1990 to 1992. He received an MSc degree in electrical engineering from Texas A&M University. E-mail: [email protected]
Berthold Kriegshauser has been working as a research scientist for Baker Atlas since 1994. Before joining Baker Atlas, he was a consultant for various geophysical companies in Germany and the US. In his current position, his main tasks include tool design of electromagnetic logging instruments and development of interpretation and inversion techniques for wireline data. He received an MSc degree in geophysics from the University of Cologne, Germany, and a PhD degree in geophysics from the University of Utah.
Richard Mollison is a petrophysicist for Baker Atlas conducting interpretation development support for new technology. He worked for Exxon Production from 1979-82. From 1982-96 he worked for BHP Petroleum in production, exploration, and operations geology as a petrophysicist. From 1996-98 he was a consulting petrophysicist with NSAI. He received an MS degree in geology from the University of Arkansas and a BS degree in geology from the University of Oklahoma.
Liming Yu is senior scientist at Baker Atlas in Houston. During 1982-89 he was an assistant professor at China University of Geosciences. He worked at the Ecole Polytechnique of Montreal as a research associate before he joined Western Atlas Logging Services in 1997. His interests are electromagnetic modeling and inversion and induction logging data processing. He received an MS degree in geophysics from China University of Geosciences and a PhD degree in geophysics from the University of Toronto.
Johan van Popta joined Shell in 1979 as a research petrophysicist working in a multidisciplinary team for interpreting seismic using well data. During 1982-88 he did operational petrophysics and multidisciplinary field studies in two Shell operating companies. Since 1989 he is working in Shell Technology EP, involved with acoustic, gravity and resistivity tool development and interpretation and in reservoir monitoring. He holds an MSc degree in physics from the University of Groningen in 1977.
