Study evaluates horizontal well ultimate recovery
Twelve oil pools in western Canada provide an insight into the likely range of ultimate recovery from horizontal wells in pools where all the necessary data for detailed study are unavailable.
Eleven of these pools contain both vertical and horizontal wells, and one pool has only horizontal wells. Every pool has a sufficient number of horizontal wells and up to 8 years of production to enable forecasting ultimate recovery from decline curves.
Reserve forecasts
Evaluators seldom have the time nor are clients prepared to pay for either full reservoir studies, simulations, or material balance studies when requested to update a company's annual reserves or look into a property acquisition.
Yet the evaluator is still requested to make a reasonable forecast and evaluation of future oil recovery. This can be particularly difficult for new horizontal wells or those producing for less than 2 years.
Decline curve analyses of oil recovery from horizontal wells such as that by Mutalik and Joshi1 are only useful if all necessary information is available. The Mutalik and Joshi method requires 13 reservoir parameters, several of which are not always available and others may vary over the life of the well. For example, drainage lengths along and perpendicular to the wellbore are not always straightforward in a pool with a mixture of producing vertical wells and adjacent horizontal wells going in different directions.
Also, flowing bottomhole pressure probably will decline with depletion and hence is a parameter that also needs to be extrapolated into the future.
Forecasting of production and ultimate recovery from vertical oil wells has been undertaken for many years, and there are many thousands of wells from which to make comparisons.
This is not the case for horizontal wells because the technology of drilling and producing these wells is more recent, and the database of wells with sufficient production for analysis is much smaller.
Because of the high initial production rates associated with many horizontal oil wells, it is easy to assume large oil reserves will be recovered, although this might not be the case.
This article describes a method for determining a likely range of production profiles and ultimate reserves that applies to horizontal wells.
The application of the method to the Tatagwa North Midale pool in Saskatchewan will be described in detail and overall results will be compared to the following 11 other pools:
Tatagwa North Midale
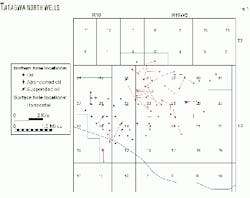
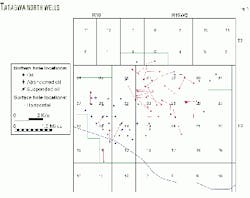
The Tatagwa area produces oil from Midale beds. The formation is a dolomitic limestone in the Madison group of the Mississippian. Oil productivity is not necessarily determined by structure. Occasionally, high water saturations are encountered at high structural positions, making it difficult to assess optimal horizontal well locations. Fig. 1 shows the field's outline.
Reservoir parameters are as follows:2
- Original oil in place: 33.747 million cu m (212.4 million bbl).
- Net pay: 14.93 m (49 ft).
- Porosity: 16.9%.
- Water saturation: 27.0%.
- Formation volume factor: 1.025.
- Density: 900 kg/cu m (25.5° API).
- Depth: 1,470 m (4,823 ft).
The reservoir produces with a solution-gas drive and some water drive.
The first well started producing in 1956. This was followed by production from a second well in 1961 and the remaining wells from 1984 through 1992. A total of 40 vertical wells are in the reservoir, and in August 1999, 21 were producing at 211 bo/d (10 bo/d/well) with a 86.6% water cut. Cumulative production was 1,440 million bbl.
The likely ultimate recovery, exponential decline to 2 bo/d, is 1.693 million bbl or 0.8% of original oil in place.
Recovery to August 1999 was about 85% of the estimated ultimate recovery. At the end of 1991, after drilling the first five horizontal wells, the vertical wells had recovered only 750,100 bbl or 0.35% of original oil in place. This recovery, however, was about 44% of what had been estimated as the likely ultimate recovery from all the vertical wells.
The average vertical well recovery is about 43,000 bbl.
Horizontal wells
Five horizontal wells were put on production in 1991. This was followed by two more in 1992, three in 1993, three in 1994, one in 1995, seven in 1996, and nine in 1997. The August 1999 production from these 30 horizontal wells was 611 bo/d (21.8 bo/d/well) with a 82.8% water cut. Cumulative oil production amounts to 2.047 million bbl.
The likely ultimate recovery, exponential decline to 3 bo/d/well, is 2.747 million bbl or 1.3% of original oil in place. Recovery to August 1999 was about 74.5% of estimated ultimate recovery. Average horizontal well recovery will be about 92,000 bbl.
The economic limits are based on approximate operating costs obtained from one of the pool's operators.
Recoveries
The estimated exponential-decline recovery from both vertical and horizontal wells is 4.440 million bbl, or 2.1% of the original oil in place. Total recovery to September 1998 was about 72% of the estimated ultimate recovery.
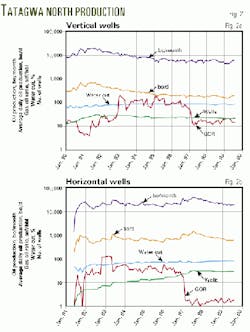
The vertical well overall decline (Fig. 2a) from 1995 through mid-1999 was low regardless of the increasing number of horizontal wells put on production. The study did not note any indication of interference among wells. Also, water cuts during the period gradually increased.
The study forecast recoveries from individual well plots, but not all declines were obvious. One cannot forecast the production performance of the combined wells because horizontal wells were drilled in small groups each year (Fig. 2b).
For each individual well, production forecasts were made after the initial steep decline flattened. Therefore, the decline approximated an exponential decline rather than a hyperbolic decline.
The study indicated that the overall water cut in the horizontal well steadily increased but has not yet reached the average of the vertical wells.
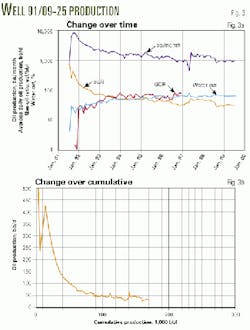
Well 91/09-25 had the highest peak rate of 724 bo/d on the first day of production (Figs. 3 and 4). To date, the well has the third highest cumulative oil production, of 159,000 bbl. It began producing in August 1991 and during August 1999, it produced 31 bo/d with a 63% water cut. The initial steep production rate decline lasted for about 1 year before a more gradual decline began when the production had decreased to 70 bo/d, or about 10% of the initial rate.
A steep initial oil production decline is typical of most of the horizontal wells reviewed.
The peak rates for all horizontal wells ranged from 22 to 724 bo/d, with an average peak rate of 161 bo/d. Ultimate recovery estimates range from 20,000 to 279,000 bbl, with an average of 91,500 bbl.
Production analysis
The study included four types of curves with wells divided into three groups, based on cumulative oil productions. Each group consisted of one third of the wells. Group 1 had the wells with the longest history, and the third group included wells with the shortest production history.
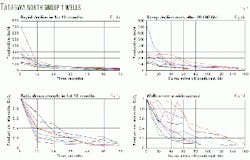
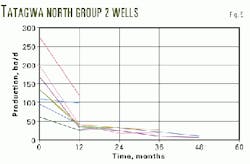
In general, the two groups with the highest cumulative production showed rapid declines during the first 12 months of production (Figs. 4a and 5). The plots for the third group are not included because these wells generally had less than 1-year of production, an insufficient time to forecast ultimate recovery.
Oil production rates of cumulative oil production after every 10,000 bbl of production show a steep decline that ends between 20,000 to 40,000 bbl of production (Fig. 4b). A few wells did not have a steep decline period.
The ratio of the oil rate each 12 months to the initial peak rate (Q/Qi) dropped rapidly in 12 months and less rapidly in the second 12 months. More gradual declines occurred after about 24 months (Fig. 4c).
The ratio of the oil rate after each 10,000 bbl of production to the initial peak rate shows a wide spread in performance. Most wells show a steep decline in the 20,000-40,000 bbl range, although a few wells produced 40,000-60,000 bbl before decline lessened (Fig. 4d).
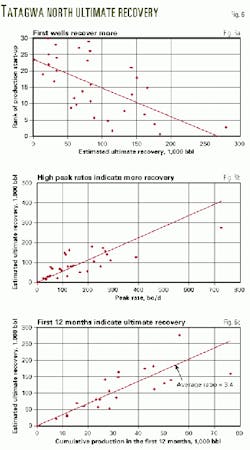
Fig. 6a shows the rank (time) of production start-up to estimated ultimate recovery. This indicates that the last wells drilled will have the least ultimate recoveries. The last eight wells (26% of the total) averaged less ultimate recovery than the average vertical well.
A plot of the rank of estimated ultimate recovery vs. the rank of production start-up (not included) showed a wide scatter, but a rough correlation exists so that in general the earlier wells have the highest ultimate recoveries, and the newest wells have the lowest recoveries.
A plot of peak rate vs. estimated ultimate recovery roughly correlates increasing ultimate recovery with increasing peak rate. The best-fit line suggests about 57,000 bbl of ultimate recovery for each 100 bo/d of peak rate (Fig. 6b).
Probability plots (not included) of the first 12 months of production indicated that the 12 month production has a median of 35,000 bbl with an average of 32,500 bbl. Also, the median ultimate recovery is 130,000 bbl with an average of 111,000 bbl.
These numbers differed slightly from the overall averages because wells with less than 12 months production were omitted from the analysis.
A plot of estimated ultimate recovery to the first 12 months oil production shows a reasonable correlation (Fig. 6c). The overall average ratio of ultimate recovery to first 12 months production is 3.4. The ratio ranges from 1.87 to 5.32.
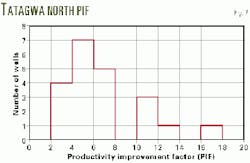
Fig. 7 shows the productivity improvement factor (PIF) vs. the number of wells. PIF is discussed in a paper by Beliveau.3 For this analysis, it is defined as the total production over the first 12 months of horizontal well production to the average vertical well (calendar day) production in the same year.
Beliveau suggests that the horizontal well rate should be compared to an offsetting vertical well rate. Thus, the use of total pool vertical production, as in this article, is a more generalized approach.
The Tatagwa North PIF plot shows a somewhat similar shape to those of Beliveau; for example, the highest number of wells is at less than the average PIF. This suggests a log-normal distribution as was Beliveau's conclusion for this type of plot.
The PIF for this field had an average of 7, a median of 6.8, and ranged from 2.5 to 17.1.
Comparison of all pools
The study compared all 12 pools with the method, as described previously. From a review of 459 individual wells, the study estimated ultimate recoveries for 354 wells. The horizontal well production history averaged 31/2 years with some wells producing for up to 8 years.
Table 1 compares the 12 pools, and also shows basic pool reservoir parameters as reported by government agencies.2 4 5
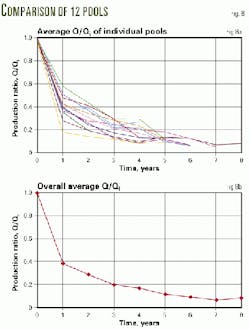
Figs. 8a and 8b show the plot of Q/Qi vs. time for the horizontal wells from the 12 pools. Fig. 8b is the overall average estimated from the data in Fig. 8a.
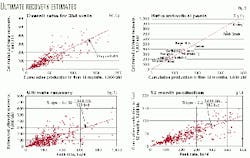
Fig. 9a shows that the overall ratio of ultimate recovery to the first 12 months production is 2.65 for the 354 wells. It should be noted that individual pool and well ultimate recoveries can vary considerably from this average. The recovery ratios ranged from 2.3 to 3.88 with an average of 2.78. Individual well ratios ranged from 1.0 to 8.29.
Although there is substantial scatter on Fig. 9a, the average lines for each pool are generally close, as shown on Fig. 9b.
The highest peak rates for horizontal wells usually occur close to the initial month of production. Figs. 9c and 9d show rough correlations of ultimate reserves and the first 12 months production peak.
The overall cumulative production (in 1,000 bbl units) in the first 12 months is 0.2 times the peak oil rate (in 100 bo/d units). The overall estimated ultimate recovery (in 1,000 bbl units) is 0.459 times the peak oil rate (in 100 bo/d units).
These 12 pools' range of additional reserves (in 1,000 bbl units) to peak rate (in 100 bo/d units) ranged from 24.5 to 68.7, with an average of 50.9.
The average PIF is 6.08 for the 11 pools with vertical wells. The pool PIF ranged from 3.3 to 10.2, and individual well PIFs ranged from 0.23 to 25.3. In general, the statistical distributions of PIF indicate a log-normal distribution.
In a few of these pools, the vertical well oil production rate decline accelerated after the horizontal wells started producing, although the study did not review the interference effects in detail.
Study results
Based on the overall average results from these pools, the most useful finding is that the first year of horizontal well production can indicate ultimate recovery. Thus, after only a few months of initial decline, one can forecast the first year production and thereby estimate oil rate at year-end and the subsequent decline for determining ultimate recovery.
If vertical wells produce from the pool, an estimate of their production during the year in which new horizontal wells are placed on production can act as a rough guide to the likely horizontal well average production rates during the first year, by using the PIF method and assuming an average PIF for those wells.
If the vertical wells around a horizontal location are good producers, then the horizontal wells on average will be also be good producers.
Where enough information is available for detailed reservoir study, the method presented in this article may be used to test the order of magnitude of the results from the calculations.
The study confirms the industry practice of high-grading well locations so that the best wells are drilled first. It, however, does also caution that to prevent uneconomic wells, a careful review of the pool is required before drilling subsequent horizontal wells.
The statistical distribution of likely horizontal well performance indicates that some of the earlier wells will also have less than average performance, and may be uneconomic. A project with many drilling locations would statistically have a better chance of overall success.
The information summarized in this article can be useful in screening pools for horizontal well locations. It discusses the ranges of ratios of ultimate recovery from exponential decline to first 12 months production, recovery to peak rates, and PIFs that can be expected in practice.
There are many factors involved in well performance. This empirical study has not, for example, looked at horizontal well performance to direct offsets, oil pay thickness, or horizontal section length. Published lengths were reviewed for three of the pools, but no correlation with recovery was found.
In some pools, production decline may not be exponential and these wells might recover more oil than would be estimated from exponential decline. But exponential decline can be initially used to indicate ultimate recovery until such time as other decline trends have been clearly established.
Acknowledgments
The author acknowledges the guidance of Ashok K. Singhal of the Petroleum Recovery Institute, Calgary, for suggesting this topic and advising on the study. Also, Patricia Gomez did most of the calculations and plots.
References
- Mutalik, P.N., and Joshi, S.D., "Decline curve analysis predicts oil recovery from horizontal wells," OGJ, Vol. 90, No. 36, Sept. 7, 1992.
- Saskatchewan Energy and Mines Reservoir Annual, 1996.
- Beliveau, D., "Heterogeneity, Geostatistics, Horizontal Wells, and Blackjack Poker," JPT, December 1995, page 1,068.
- EUB, Alberta's Reserves 1997.
- Hydrocarbon and By-Product Reserves in British Columbia 1997.
The author
Ian Martin is a principal at Martin & Brusset Associates, Calgary. He previously worked for several oil companies in management and engineering. Martin has a BS in petroleum production engineering from the University of Birmingham, UK, and a graduate engineering diploma and an MBA from the University of Calgary. He is a member of the Association of Professional Engineers, Geologists, and Geophysicists of Alberta, the Society of Petroleum Engineers, and the Petroleum Society of CIM.
