"Boutique' gasolines main culprit in US Midwest price spikes
This is the second of two articles focusing on the controversy surrounding gasoline price spikes in the US. This week, PIRINC offers an in-depth analysis of the causes of this dilemma and how they point to more trouble ahead.
Few subjects attract as much public outcry as rising gasoline prices. The past several weeks have seen both, especially in certain areas of the Midwest.
In mid-June, the US average gasoline price was up by about 50¢/gal vs. the same time last year ($1.66 vs. $1.15/gal); about 20¢ of the increase occurred since the beginning of May. These averages conceal wide geographic disparities. East Coast, or PADD 1 (Petroleum Administration for Defense District 1), year-on-year gasoline price increases averaged about 47¢/gal, while in the Midwest (PADD 2), the increase averaged 71¢, and in reformulated gasoline (RFG) areas, 85¢/gal.1 These gasoline price increases far exceeded the increase in crude prices, which rose by 33¢/gal vs. mid-June 1999.
There have been numerous recent calls for investigations of industry "price gouging," including a request by the administration of Pres. Bill Clinton for the Federal Trade Commission to conduct an expedited review of price developments.
This article focuses on factors contributing to US gasoline price increases, including the most severely impacted areas of the Midwest. Many commentators have made the point that price increases, especially in Chicago and Milwaukee, have far exceeded the apparent costs of producing the new Phase 2 RFG required this year under EPA mandate.
While costs are important, price in the short term is determined by the interaction between supply and demand. Price serves a critical function in a competitive market, namely adjusting demand to accommodate changes in supply conditions. When price is not allowed to play this role, the result is long lines at the pumps, rationing, or outright shortage.
US consumers require a relatively stable amount of gasoline for their normal routines, with limited possibilities for using less when the price goes up and not much reason to use more when the price goes down, especially in the near-term. Thus, in economic terms, demand for gasoline, a necessity for most consumers, has a very low near-term price elasticity. As a result, the price adjustments tend to be disproportionately large.2 Over time, however, history shows that prices are self-correcting.
Why higher prices now?
There are several identifiable factors that contributed to the run-up in prices. These include the rise in world crude prices resulting from production decisions by the Organization of Petroleum Exporting Countries and low world oil stocks. Within the US, interrelated problems associated with the introduction of more-stringent, Phase II RFG this year inhibited both domestic production and imports. The Unocal Corp. patent infringement case further inhibited supply (OGJ, July 10, 2000, p. 22). Disruptions to the logistics system, notably to pipelines serving the Midwest, and problems of blending ethanol instead of MTBE (methyl tertiary butyl ether) in making Phase II gasoline contributed to even sharper price increases in the Midwest.
Apart from the increases in crude prices and the exceptionally low level of oil stocks, the other factors alone would have had minimal impact. But, together, they produced a noticeable supply shortfall in a product with an extremely inelastic price and thus a sharp increase in gasoline prices.
As production and logistics problems are overcome, prices will moderate; this is already happening (see Market Movement, Newsletter, p. 5). However, until inventories are rebuilt, the system remains vulnerable.
Global, national considerations
A significant increase in US gasoline prices was inevitable, given the worldwide increase in crude oil prices that began early last year. From its low point of about $12/bbl, or 29¢/gal, in February of last year, the price of West Texas Intermediate rose to nearly $18/bbl (43¢/gal) by June 1999 and rose further to $32/bbl (76¢/ gal) in mid-June this year. Another element influencing prices is the exceptionally low level of inventories worldwide.
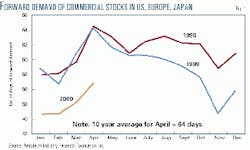
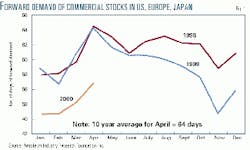
In Fig. 1, commercial oil stocks for the three major Organization for Economic Cooperation and Development consuming regions are measured in terms of days of forward, or anticipated, demand since January 1998. In 1998, and through early 1999, stock levels were extremely high. April stocks for both years amounted to just over 64 days of forward demand, well above the 1995-2000 average of 61 and higher than any year since 1993.
These high inventories were a major depressing influence on the world oil market. OPEC's decisions in March 1998, June 1998, and March 1999 to cut production were designed to bring down inventories and thereby strengthen the world crude market.
The first two production cuts were overwhelmed by the reductions in demand resulting from the fallout of the Asian financial crisis and recession. But the third, coming at a time of economic recovery in Asia and improved growth elsewhere, had the intended effect. Since March of last year, commercial stocks in the main OECD regions have moved sharply lower. So far this year, stocks are running at historically low levels.
The extremely low level of stocks pushed up prices, as OPEC originally intended, but it also left the world oil market without a high inventory cushion and therefore extremely vulnerable to any supply interruptions or sudden surges in demand.
OPEC intended crude oil prices to move up but now has become concerned about the extreme vulnerability of the market, and it has moved to raise official production ceilings, first in March of this year and again in June. Nonetheless, it will take time for inventories to be rebuilt to "normal" levels and for a market safety margin to be re-established.
US inventory levels
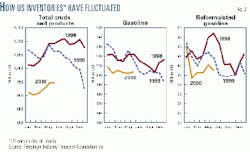
US inventories show exceptional tightness, both overall and for the product currently in the headlines, gasoline. By the end of 1999, total commercial stocks of crude and products had fallen by 15% relative to their end-1998 level (Fig. 2). There has been only minimal improvement since then. As of mid-June, total stocks were more than 100 million bbl below June 1999 levels, an 11% decline. Total gasoline stocks are running about 10% below year-earlier levels, with no significant spring build as occurred in prior years.
RFG now represents about 30% of total US gasoline sales. Stocks at the first of the year were similar to 1998-99 levels but fell sharply in February with only a marginal recovery since then. The new RFG Phase II standard came into effect on May 1; at the retail level, the deadline was June 1.3 Inventories began to fall at the first of the year in anticipation of the changeover to the new standard. The problem has been insufficient build-up of the new Phase II product. Mid-June stocks are 6% below the June 1999 level and 16% below the June 1998 level, despite the rise in demand.
US gasoline supply-demand
Low gasoline stocks mean minimal flexibility to meet unanticipated supply developments, which have, unfortunately, occurred.
A year ago, the US Department of Energy projected a reasonable 2% growth in US gasoline demand for 2000 vs. 1999 and an average retail price of $1.20/gal. DOE's estimate anticipated moderate prices and economic growth of 3.6% for 1999, decelerating to 1.7% this year.
It was assumed that gasoline stocks would remain about level and that supplies of gasoline from domestic and foreign refineries would grow in line with projected demand.
This did not happen. For the year to date, production is up 100,000 b/d over 1999, an increase of 1.5%, and imports are running about 150,000 b/d below year-ago levels, a decline of about 4%.
Total US supplies of finished gasoline from imports and domestic production are up only 1%, or about 85,000 b/d, so far this year-about 1 percentage point less that DOE's anticipated demand growth rate. Moreover, economic growth has been much stronger than anticipated. US gross domestic product growth this year in DOE's latest forecast is now projected at 4%-other forecasters are projecting 5%-well above their projection of a year ago. The much-higher projection indicates that, in the absence of the sharp price increases seen this year, demand growth would have been well above the 2% rate.
Low price elasticity
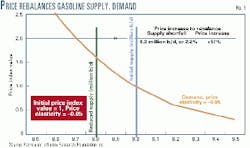
As noted earlier, consumers find it extremely difficult to cut back their normal use of gasoline, especially in the short term. Because gasoline price is so inelastic, price increases tend to be disproportionately large for what appear to be very modest shortfalls in supply. A reasonable estimate, in line with recent experience, would place the short-term price elasticity for gasoline at about -0.05. A downward sloping demand curve with a constant price elasticity of -0.05 intersects an initial supply curve fixed at 9 million b/d at a price index value of 1.0 (Fig. 3). 4
If supply is suddenly reduced to 8.8 million b/d, a decline of 2.2% from its initial level, the price has to rise by nearly 60% to clear the market. 5 For the week ended June 19, DOE reported US gasoline prices averaging about $1.70/gal, up 56¢, or about 50% from their average a year ago. This is about the increase required at the national level to offset a shortfall in anticipated supplies of about 2%, given the low estimated price elasticity of gasoline.
The 2% figure is in line with estimates of short-term supply losses (2-3%) arising from the impact of the more-severe Reid vapor pressure (volatility) requirements for Phase II RFG, the effects of the Unocal patent infringement judgment on refiners and blenders, and the reduced availability of imports. These problems apply only to summer specifications for RFG and will not apply to supplies after Sept. 15.
Regional price disparities
So far, the discussion has focused on national trends, but this year in Chicago and Milwaukee and last year in California, the public has been concerned about local price spikes in excess of national trends.
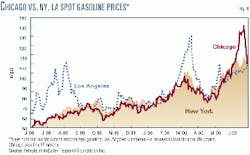
Fig. 4 shows daily movements since last June in spot prices for gasoline in New York, Los Angeles, and Chicago. The prices used are the New York harbor price for reformulated 89 octane, Los Angeles (California Air Resources Board reformulated) 89 octane, and Chicago (nonreformulated) 89 octane. At this time last year, spot prices in Los Angeles ran far above New York and Chicago prices, with differentials exceeding 40¢/gal at their peak. Los Angeles also experienced a brief price spike again this year in March. Until late in May, Chicago spot prices tended to run slightly below the New York prices. But toward the end of the month, a substantial differential opened up as Chicago prices rose to peaks in the second week of June roughly 30¢/gal above New York prices. They have subsequently declined, slipping below New York prices as of June 21. However, these price movements don't fully capture the price developments in the Chicago area.
The Chicago prices shown are for nonreformulated regular gasoline, while prices shown for New York and Los Angeles are for RFG. Chicago and Milwaukee, both designated by US Environmental Protection Agency as ozone nonattainment areas, are required to use RFG. Both use an RFG with ethanol as the oxygenate as opposed to MTBE, generally used elsewhere in the country.
Because ethanol is not a petroleum product, it must be segregated from other gasoline components up to the rack, the point just before delivery to the pump. At that point, it is added to an RFG blendstock for oxygenate blending (RBOB) specially formulated to be used with ethanol. RBOB accounts for about 90% of the total volume of a gallon of RFG made with ethanol.
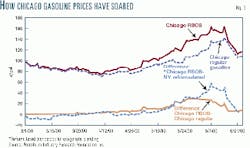
The spot price of Chicago RBOB is typically about the same as the price of regular shown in Fig. 4. But this year has been very different. As shown in Fig. 5, in early March, the Chicago spot price of RBOB was almost identical to the price of regular. By mid-April, the differential had widened to about 5¢/gal and by early May, 10¢. By late May into early June, the differential reached about 30¢/gal. Since then, the differential has fallen back to about 7¢.
The dotted line at the bottom of Fig. 5 shows the differential between the spot price of Chicago RBOB and New York RFG. In early June, the differentials peaked at nearly 60¢/gal. As of late June, the differential was down to about 4¢/gal.
Retail price developments
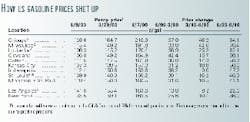
For consumers, the sharp rises in spot prices for ethanol-based RFG have meant exceptionally high increases in pump prices in Chicago and Milwaukee. The table shows pump prices for self-serve regular in Chicago, Milwaukee, and selected other Midwest cities, as well as Los Angeles and New York for June 9, 1999, Mar. 29, 2000, and June 7, 2000.
For the span of the first two dates, pump price increases for the Midwest cities shown were 30-42¢/gal, with neither Chicago nor Milwaukee standing out. Note the exceptionally low price change for Los Angeles, a result of the price surge the year before in California following supply problems.
The pattern of price changes is very different for March-June of this year. Chicago and Milwaukee show by far the largest price increases, up 46 and 43¢/gal, respectively. Louisville, another RFG area, is next with an increase of 25¢. Elsewhere, the price increases were 8-16¢.
It is precisely these large local pump price spikes that trigger public anger, confusion, and demands for investigations. If gasoline were a uniform, fungible, easily transportable product, then, in a competitive market, such large spikes should not occur-and if they did, the public would have every reason to be suspicious about just how competitive the market really is.
But the problem is that regulatory developments have made gasoline less uniform, or fungible, and more difficult to transport, thereby reducing the ability of the supply system to respond quickly to threats of shortage. The areas of the country most vulnerable to this problem, and therefore to price spikes, are the two that have had them, California and Chicago-Milwaukee.
'Boutique' fuels
Although California and the Chicago-Milwaukee areas are geographically very different, with respect to gasoline, they are both "islands," dependent primarily on local sources for supply and difficult to reach from elsewhere. Their isolation from the rest of the country is the result of their dependence on "boutique" fuels not readily available elsewhere.
California has imposed more-severe requirements for RFG than the rest of the US. In 1999, a series of refinery problems reduced production at a time of rising local demand. PADD 5 production of RFG in May-June 1999 was down by about 50,000 b/d, or about 5% from the year before. This was the period of the sharpest spikes in spot Los Angeles CARB gasoline prices last year. Only in August did production finally return to similar levels of the previous year (about 969,000 b/d) and in November-December significantly exceed 1998 levels. New refinery problems in March of this year resulted in temporary production losses and the price spike that occurred at the same time.
Refiners elsewhere in the world have some limited capability to make CARB standard reformulated, although those that do so must take into account the time and cost required to ship the product to California as well as the additional cost of making it. For US refiners, an additional cost element is the requirement to use US flag ships.
Imports of RFG into PADD 5 did indeed increase, reaching a peak of 30,000 b/d in July vs. none the year before. The increased imports, coming from as far away as Finland and Asia, moderated the price spike, but only a return to normal refinery operations brought it to an end.
Chicago, Milwaukee
Chicago and Milwaukee are also "islands," but for a different reason-their use of ethanol as the oxygenate for RFG. Phase II RFG requirements came into effect this year. While its introduction began in January at the refinery level, the more-critical summer standard (with lower volatile organic compounds emissions) did not apply until May 1, or in the case of retail facilities, June 1.
At the national level, the more severe requirements had certain particular consequences, especially on availability of imports. So far this year, US total production of RFG is slightly above last year's levels, but imports are down. Production (2,532,000 b/d) through June 16, 2000, has averaged 12,000 b/d above year-earlier levels-a growth rate of only 0.5%. Imports, however, are down 28,000 b/d (to 172,000 b/d) over the same period, indicating some loss of ability to supply the reformulated product under the new, more severe standards.
In November 1999, EPA estimated that additional costs of Phase II RFG would average about 1-2¢/gal more than Phase I, with costs somewhat higher for some parts of the country and for some refin- ers:6 "It is not possible to accurately predict the retail price of Phase II RFG in the year 2000, because it will be influenced by many factors, including production costs, weather, crude oil prices, taxes, and local and regional market conditions. It is important to note that, at the start of the Phase II RFG program, retail prices may be higher or fluctuate more."
Clearly this was indeed the case for Chicago and Milwaukee, where "local and regional market conditions" were adverse. Chicago and Milwaukee are the principal areas in the Midwest required to use RFG. St. Louis voluntarily opted into the program in 1999 but received a temporary waiver last month in the face of significant loss of supplies due to problems with the Explorer pipeline. The Cincinnati and Louisville areas also opted into the program but have had no comparable supply difficulties.
Even though Chicago and Milwaukee are distant from other consuming centers, this alone would not account for their problems. After all, both are ports, and Chicago is a major rail, highway, and pipeline center. But they are unique in their reliance on ethanol as the oxygenate for RFG. When it became more difficult than anticipated to make the ethanol-based Phase II product, there was nowhere else to turn for immediate relief.
Ethanol-based RFG supply
Ethanol-based RFG requires a unique blendstock, RBOB, generally not made elsewhere, and any MTBE-based RFG could not be comingled with the local supply; therefore it could not be moved through normal distribution channels.
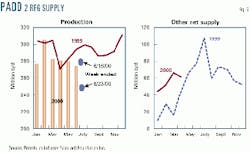
Specific supply figures for Chicago and Milwaukee are not available, but overall figures for PADD 2 indicate what has happened. Fig. 6 summarizes supply conditions for RFG in PADD 2. In general, production has been running below year-earlier levels, with shortfall especially noticeable in June, the start of the Phase II program at the retail level.
The most recent data for the weeks ending June 16 and June 23 show no consistent improvement. So far this year, PADD 2 production of RFG has been running about 3% below 1999 levels. This differs from the national output, where production is slightly above year-ago levels. For June, the situation was much worse, with production in PADD 2 running about 7% below June 1999 levels.
In principle, a shortfall in local PADD 2 production could be moderated, or even eliminated, by increased supplies from other sources, imports, stocks, or shipments from other regions of the country. In reality, imports of RFG are virtually zero, and stocks are typically very low-at 1-2 million bbl, or about 2-4% of total US RFG stocks-well below the PADD 2 share (about 10%) of total US RFG demand.
The absence of imports and low RFG stocks are consistent with a disproportionate reliance on ethanol, because problems of comingling severely limit prospects for imports and make holding the finished product difficult.
Fig. 6 also shows trends in net supply of RFG, excluding local production. By default, the figures almost exclusively reflect shipments from elsewhere in the US, primarily PADD 3. The latest data available are for April of this year. Early in the year, shipments were running well ahead of year-earlier levels. But shipments fell back in April to year-earlier levels.
In addition, the Explorer pipeline, the major carrier of oil products to the Midwest, was shut down for 10 days in March and has run at reduced levels since then.
Signs of improvement
Although data are sparse, there are already some tentative signs of improvement. Disruptions in the logistics system are being addressed. However, the sharp run-up in Chicago area prices appears to have encouraged extraordinary efforts to bring in supply. This is showing up in a recent rise in RFG stocks in PADD 2, although they remain low relative to other areas of the US.
While end-of-month stocks in January-February of this year were ahead of 1999 levels, they fell back in March-April to about year-earlier levels (about 1.1 million bbl). In May, they also tracked levels of a year ago. As of June 23, inventories have risen by about 0.6 million bbl above their end-May level and 0.4 million bbl above their level at the end of June 1999. The buildup was particularly noticeable in the first 2 weeks of June. This buildup (from 2 million bbl to about 2.4 million bbl), although modest in overall volume, came despite lower production of RFG within PADD 2 itself.
In effect, the modest inventory build in the face of a production decline could occur only if extraordinary efforts were under way to make and ship the product from elsewhere by barge, rail, or even tanker trucks.
The latest DOE statistics indicate that the improved local supply situation is filtering through to retail prices. DOE reports that the average price of gasoline in PADD 2 reformulated areas fell from $2.01/gal on June 16 to $1.92/gal on June 23, a decline of 9¢/gal. This was a larger decline than reported for the US as a whole of 2¢/gal (from $1.71 to $1.69) for all gasoline (and from $1.73 to $1.71 for gasoline sold in RFG areas). Retail prices in Chicago and Milwaukee should continue to decline. However, retail prices move more slowly than spot prices. Just as the price increases seen by consumers lagged prices paid by dealers, so too, will prices decline as dealers return to more-normal margins.
Issues for the future
While this summer's immediate gasoline problems are easing, they highlight serious regulatory issues that remain with us. None of the individual problems contributing to national, and especially local, gasoline price run-ups were major in and of themselves. However, they came together in the context of a tight global oil market. This condition may persist for some time.
The regulatory system currently in place adds significantly to national and local vulnerabilities.
The multiplication of "boutique" gasolines reduces the flexibility of the distribution system to respond to local supply problems. When supply problems develop, the regulatory authorities are then faced with a choice of going back on their standards, at least temporarily, or standing by and accepting the inevitable, necessary price spikes. Currently, authorities seem to have chosen a modified version of this alternative, namely stand by and demand investigations.
If standards are waived, then those in the industry who made the greatest effort to meet the standards are penalized relative to those who did the least. Creating a "no good deed goes unpunished" precedent sends exactly the wrong signal for future compliance efforts. Moreover, there are other regulatory actions that could lead to similar choices. EPA and many states are moving towards a 3-year phase-out of MTBE (penalizing those who invested to produce it in the first place). Because of current oxygenate requirements for RFG, this phase-out will mean greatly expanded use of ethanol in producing the Phase II product. Given the problems encountered with ethanol this year, it would be rash to assume a smooth path in the future.
The requirement for the use of an oxygenate is itself questionable, because vehicles with fuel injection instead of carburetors-fuel injectors have been in use since 1983-don't need it. California, the country's leader in fuel stringency, has asked that the oxygenate requirement be waived.
There is no argument about the need to improve local air quality. Vehicle emissions will continue to be a legitimate, prime target of regulatory concern. But recent price developments are an urgent signal of the need to reassess the process in view of the supply risks associated with the present system, especially if tight global market conditions persist.
References
- RFG areas are ozone nonattainment areas where reformulated gasoline is required. The sharp price increases in Midwest RFG areas, especially Chicago and Milwaukee, did not occur in other regions. In PADD 1, prices in RFG areas rose by about the same 47¢/gal as the overall average for the region since mid-June 1999.
- A relatively large change in price is required to elicit a small change in demand, e.g., if price elasticity = -0.1, a 10% increase in price reduces demand by only 1%. If price elasticity = -1 (unit price elasticity), demand would drop in proportion to the price change. The price elasticity for gasoline in the very near term is even smaller than -0.1, as is discussed later in the article.
- January 2000 was the first month in which Phase II standards applied to gasoline production and imports. Because the oxygenate and benzene standards were unchanged, the program effectively impacted the supply chain when the more-severe summer VOC standard came into effect.
- Last year, gasoline demand for June-August was about 8.8 million b/d. A 2% increase for 2000 would raise demand to about 9 million b/d. Supply is production plus imports plus stock change.
- For a 0.1 million b/d, or 1.1%, reduction in supply, the price increase would be 25%. For a 0.3 million b/d loss of supply, or 3.3%, the price would have to double to clear the market.
- The complete Fact Sheet may be accessed on the internet at www.epa.gov/oms/ f99040.htm.
The authors
Larry Goldstein is president of PIRA Energy Group and president and a member of the board of the Petroleum Industry Research Foundation Inc. (PIRINC), NewYork. He has been a member of the Petroleum Advisory Committee of the New York Mercan- tile Exchange and a contributor to studies by the National Petroleum Council. He served as a board member and treasurer of the Scientists Institute for Public Information.
Ronald B. Gold is a consulting senior adviser to PIRA Energy Group and a consulting vice-president of PIRINC. He retired from Exxon Corp. at yearend 1997, where he was company economist and manager of the Energy Outlook division for Exxon Co. International. Gold also has worked for the US Treasury Department, Office of Tax Analysis, and was an assistant professor of economics at Ohio State University. Gold has an undergraduate degree from Brooklyn College, City University of New York, and an MA and PhD in economics from Princeton University.
