The solar photovoltaics business: Has its time arrived?
As we know, the sun is responsible for most of the earth's energy in one way or another.
Plant photosynthesis provides the basis of our fossil fuels such as coal and oil. At the same time, heat from the sun is again indirectly responsible for other common forms of renewable energy, such as wind and wave power.
Solar power, in its accepted working definition, is the supply of energy directly from the sun. It is made up of two very distinct technologies, solar thermal and solar electricity.
The first is based on the principle of using the sun's direct heat energy and is most commonly used for supplying hot water for houses and swimming pools.
It is solar electricity with which this article concerns itself. This is a technology where the light from the sun is converted directly into electricity: this process is known as photovoltaics (PV).
Past and present
Despite its rise to prominence in the 1970s and 1980s, this industry can trace its origins back 150 years.
The actual photovoltaic effect was first noted over 150 years ago by Prof. Henri Becquerel. He observed a light-dependent voltage between two electrodes immersed in an electrolyte. Albert Einstein united these threads with his theory of the photoelectric effect in 1905, which proposed the existence of the light photon (for which he received the Nobel Prize).
Further practical application of this work had to wait until the acceleration of the world's space programs during the late 1950s. From there. the industry has grown in leaps and bounds.
During the mid-to-late 1970s, major improvements in material processing techniques resulted in cheaper, more-efficient solar cells. This, coupled with improvements (i.e., reductions in power consumption in telecommunication devices), provided the necessary spur for the adoption of solar as a viable energy source for terrestrial applications. This time also witnessed a dramatic rise in conventional fossil fuel prices and the realization that they were finite. This gave a fresh impetus to the research and technology being undertaken in this area.
As further improvements in cell processing continued throughout the late 1970s and early 1980s, resultant cost reductions have made solar power an economic proposition for an increasing range of applications.
How it works
At its simplest, the solar cell works like a diode. Silicon is intensely refined to remove all the unwanted impurities. Half is then doped with boron, which has excess positive electrons, and half with phosphorus, which has excess negative electrons. When light photons hit the cells, this results in the movement of electrons between the boron and phosphorous-doped silicon (exactly as a P-N junction diode). This is then collected by a metal backplate and grid on the cell as electricity.
The early work by Becquerel involved selenium, and it wasn't until 1954 that the present dominance of silicon began as the major raw material for solar power systems. Silicon (in its many forms) is the second most abundant element on earth; its most well-known manifestation is sand. Availability combined with high light-to-electricity energy conversions made it the predominant industry raw material.
Future work on reducing the price of solar energy concentrates on this area of solar cells. Being the most expensive component of a solar system, it holds the secret of increasing energy-conversion efficiency of sunlight into electricity and at the same time improving manufacturing costs.
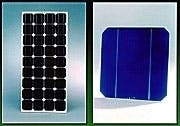
To withstand the harsh environmental conditions that they operate under, the cells are laminated between a layer of special high-transmission glass and weatherproof plastic, commonly tedlar polyester tedlar (tedlar is a Dupont trademark). Silicon cells have an inherent potential of about 0.6 v DC, so they tend to be packaged as 32-36 cells into a solar module typically 1.2 m x 0.6 m, which can give nominally 12 v DC and 75 w under industry-standard test conditions. These test conditions are 1,000 w/sq m insolation (light), temperature of 25° C, and air mass of 1.5 (the latter de-rates for the effect of light passing through the atmosphere)
The key material used by the photovoltaic industry today-as it has been for the last 20 years-is crystalline silicon solar cells. The starting material is the lower-specification silicon produced by the semiconductor silicon industry.
Silicon cells are made as thin as practicable for cost reasons, yet are still 200-350 mm thick. Considerable research goes into the saws used in cutting the silicon into cells, due to the high cutting losses. The thinner the saw, the less the losses, and, therefore, the cheaper the cell.
The question now becomes: Where this technology is going, and how is it getting there?
Energy trends
The BP Statistical Review of World Energy is an annual publication highlighting the key energy trends that emerged from the raw statistics. During the last 5 years,we have seen three very strong trends emerge that characterize global energy markets. They are:
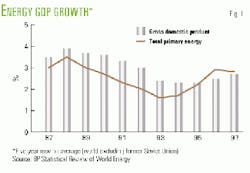
- There has been a re-emergence of a close link between energy consumption growth and the growth of economic activity (Fig. 1). This link appeared to have been broken in the late 1970s and early 1980s, when commentators started to talk about the "decoupling" of energy demand from economic activity. Over the past decade, however, we have seen a clear "recoupling," with energy consumption tending to grow almost as fast as economic activity.
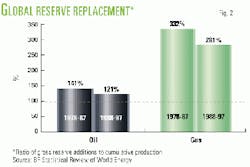
- Supplies of conventional fuels have been plentiful, with prices tending to fall. Despite dire warnings that the world was running out of oil, we have continued to add reserves of both oil and gas more rapidly than we have used them up (Fig. 2). Since the end of the era of high energy prices and perceived scarcity (marked by the oil price fall in 1986), energy producers have been under tremendous pressure to reduce costs. There has been a great deal of technological innovation, helping to reduce costs and increase the recoverability of fossil fuel reserves. The deregulation of energy markets has added to the cost pressure and increased the efficiency of the energy supply chain. These forces have combined to generate conditions of "supply push" in most energy markets across the world.
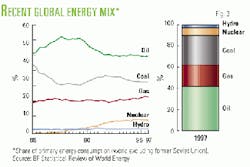
- The shares of each fuel in total energy consumption have remained remarkably stable. In contrast to the massive shifts in fuel shares seen in the 1960s, 1970s, and early 1980s, the last decade saw only modest changes in the relative positions of the fuels (Fig. 3). Oil's share has remained pretty constant at a little over 40%. Coal's share has drifted downwards, while gas has gradually gained share. Nuclear power, which was gaining share rapidly in the 1970s and 1980s, appears to have reached a plateau. The contribution of hydro and other modern renewables has hardly changed.
To summarize the current trends, we have an energy market where total consumption is closely tied to economic growth, where supplies of the conventional fuels appear plentiful, and where the fuel mix is changing only very slowly. There is a great deal of inertia in this system.
One important feature that does not emerge from the raw statistics-but which is nevertheless very real-is the demand from consumers for ever more flexible, convenient, and clean energy forms.
All of this adds up to a market that is very difficult for new energies to break into.
Energy futures
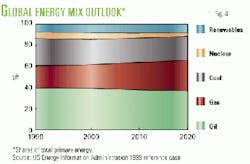
The current trends just described form the starting point for projections of the future of energy markets. Energy projections are available from a number of sources, among them the latest projection published by the US Department of Energy1 to illustrate what a typical "business as usual" forecast looks like (Fig. 4).
Unsurprisingly, and without wishing to belittle the amount of work that goes into this kind of forecasting exercise, the end result is essentially an extrapolation of today's trends.
In this projection to 2020, total world energy consumption grows at around 2%/year, a little less rapidly than does economic activity. Oil's share drifts downwards, while gas gains at the expense of coal and nuclear. The share of renewables remains more or less constant. One would see a similar picture in just about all the other "business as usual" energy projections that are available.
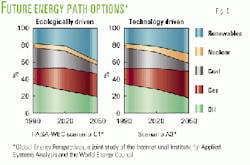
To find a projection where the share of renewables increases significantly, it becomes necessary to extend the time horizon out to, say, 2050 and to have to introduce some major trend-breakers. These are typically assumptions about major changes in policy direction or about technology paths. To illustrate this are two scenarios from the IIASA-WEC (International Institute for Applied Systems Analysis-World Energy Council) Global Energy Perspectives study (Fig. 5)2.
The first scenario (labeled C1) is driven by a concerted global policy effort to address environmental issues, notably climate change. Total energy consumption growth is constrained to less than 1%/year, and the share of renewables3 increases rapidly after 2020 to around 40%. The growth rate of renewables accelerates from 1.3%/year during 1990-2020 to 2.9%/year during 2020-50.
The second scenario (labeled A3) depicts a world of high economic growth and rapid technological development. In this particular case, the technological breakthroughs come in nuclear as well as renewables, so both these fuel categories increase their share at the expense of conventional fossil fuels. Renewables attain a 30% market share by 2050-a lower share than in the previous scenario. However, the faster growth in total energy consumption in this scenario means a higher absolute level of renewable energy supply, with a growth rate averaging 2.6%/year to 2050.
This brief review of energy futures reinforces the message that it will take a significant shift in the policy or technology environments for renewables to play anything more than a minor role in future energy supply. There are clear signs that a shift is under way, particularly with regard to growing international environmental concerns. The inertia in the energy market is being challenged by these forces, opening up new opportunities for renewables.
Renewables
How are renewable energy technologies positioned to take up these new opportunities?
First, it is necessary to be clear about what the label "renewables" covers.
Renewable energy technologies provide ways to tap into the natural flows of energy available in the environment. They are therefore not limited by a finite resource stock. They can, with careful management, supply energy services without disturbing those natural energy flows and without major impact on the key geochemical cycles that sustain life on earth. The natural flows of energy are so large relative to human needs for energy services that renewable energy sources have the technical potential to meet those needs indefinitely.
The limiting factor for renewable technologies is the very dispersed and diffuse nature of the energy flows they seek to harvest. Renewable energy resources tend to have very low energy densities (large-scale hydro sites are one of the few exceptions), which often translates into a high economic cost for the collection, storage, and transportation of renewable energy.
The principal natural energy flows are:
- Solar radiation, which can be converted into either heat or electricity via solar photovoltaic systems or solar thermal collectors.
- The kinetic energy in wind, rivers, waves, and tides incorporating such technologies as hydroelectric power generation and wind turbines.
- The chemical energy stored in organic matter-e.g., biomass, burned to generate power or converted to liquid fuels.
- The heat stored in rocks, flowing up from the earth's mantle, fueling geothermal power plants.
Renewable energy sources are very diverse. What they have in common is a tendency to cost more than conventional fuels but to offer some attractive characteristics, especially in terms of their environmental impact. It is that balance between relative cost and desired attributes that defines the place of each renewable in the portfolio of energy options.
Large-scale hydro is already a significant source of power. There are still some large projects under development-most notably the Three Gorges project in China-but most of the best sites have already been used.
Commercial biomass is already quite big in the US, where agricultural or forestry residues are used in power or cogeneration plants at the site of food or timber processing. The combustion of urban waste is an area of growing interest, because it helps solve the pressing problems of waste disposal faced by many urban communities.
Wind is an established and competitive power source in specific locations, notably California and Denmark. Wherever new renewables have been promoted by government policies, wind has been at the forefront. Visual intrusion and noise is a concern for many communities, constraining the diffusion of wind power.
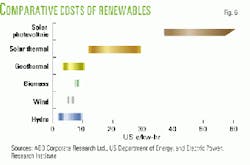
The solar technologies-both thermal and PV-are the least well-established. The relative costs of renewable sources of power show how far solar technologies, and PV in particular, have to go to get into the pack.
Solar power
So why even bother with solar power? Although it is currently disadvantaged by its high cost, we believe solar PV has the best long-term potential because (1) it has the most desirable set of attributes and (2) it has the greatest potential for radical reductions in cost.
Solar power makes a unique offer to customers. It is clean-no unwanted emissions or noise at point of use and very little environmental impact throughout the supply chain. It is modular and infinitely scalable to any size, from a solar-powered wristwatch to a multiple-megawatt power station. A solar power system requires no fueling infrastructure (unless used in a hybrid system) and very little maintenance. It can be portable.
A solar power system is unmatched as a clean power source that can be easily integrated into the urban environment. The very proximity of a PV system to users-its visibility and even "touchability"-can be a powerful way of raising awareness about energy use and the environment. This can play into broader themes of energy policy, such as promoting energy efficiency.
So "every home (and office, school, hospital and factory) should have one," the reasoning goes. But the reason they do not is the relatively high cost of solar power. The market for solar power is currently restricted to two rather narrow segments within the power market, namely consumers:
- In areas that are remote from the grid where the costs of alternative power sources are also very high
- That, either individually or collectively, are prepared to pay a significant premium for the environmental and other advantages of solar power.
Examples of the latter would include the important solar markets of Japan and Germany, where a collective willingness to pay a premium is expressed through government subsidies or rate-based incentives.
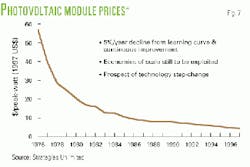
How are we going to get the costs down to the point where solar power can compete in the mass market for power? Costs have been falling at about 5%/year in real terms over the past 20 years, following a well-established learning curve.
That trend needs to accelerate. One way to do that is to step up the scale of the typical PV plant. That scale is created from a "virtuous demand" cycle. Here, governments encourage early take-up, which leads to greater throughput and in turn lower costs.
Another path to radically lower costs is a technology step-change. The bread-and-butter technology in use today is based on crystalline silicon. This is an inherently materials-intensive technology; it requires batch production methods and is now relatively mature. The great hope for the future lies with thin-film technologies, which are much less materials-intensive and are suitable for continuous production processes. They offer the potential to shift onto a lower and steeper learning curve. Plants are now coming on stream to offer these benefits
Expansion of both of these approaches threatens to dramatically alter the previous models.
Current markets
To understand the technology and where it is going, it is necessary to understand current markets.
Current PV market growth is characterized by a fairly high and stable increase of over 15%/year. As of today, solar module production is estimated to be about 150-200 Mw/year-still only very small in comparison with conventional power station output but growing fast. While costs have fallen seven-fold since 1981, it still remains an expensive technology.
So how does the market break out, and where is the growth coming from? There are several ways to look at market segments for solar, but one of the more common ones is the five key areas of telecommunications, rural infrastructure, consumer, grid-connect, and specialist segments such as navigational aids and cathodic protection.
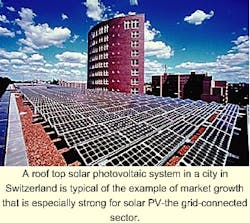
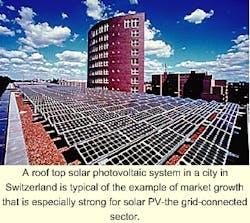
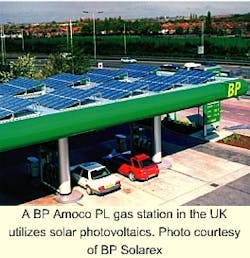
Not only all markets are growing, but there is accelerating growth in the segment known as grid-connect. Here, solar acts as a complement to the standard grid and solar is utilized in central power station markets or on individual or company buildings to supplement power to the grid. The key drivers for this at present are the reducing costs of large-scale solar developments, but above all the key environmental benefits of using a renewable energy that does not add to the greenhouse gas problem or create pollutants. There are large government programs in place in many countries to stimulate the take-up of solar. Of note are Japan, Germany, Switzerland, the Netherlands, and the US. The German government recently announced a scheme that would provide a subsidy of about 99 pfennigs/kw-hr, nearly 10 times the cost of conventional power generation. - A BP Amoco PL gas station in the UK utilizes solar photovoltaics. Photo courtesy of BP Solarex.
So what effect is this growth in the grid-connect market having on the solar industry? First, companies are adapting to a different market. There is now a need to consider reduced installation costs and architectural choice in solar module design.
Second, governments recognize that, having made commitments to carbon emissions reductions in Kyoto, encouraging renewables such as solar is one of the most appropriate ways of doing this and providing a bedrock for future energy generation
Conclusions
There is a great deal of inertia in the energy market. A combination of growing environmental concern and the further development of new energy technologies, however, is overcoming that inertia and creating a significant role for renewables in the world's energy mix. With solar photovoltaics having such large potential for use in urban areas and cost reduction, it is apparent its time is just arriving.
References
- EIA, 1999.
- Nakicenovic, et al. (eds.), 1998.
- The IIASA-WEC scenarios start with a current renewables share much higher than in the BP or US DOE numbers, because they include traditional biomass.
Bibliography
ABB, 1998, Renewable Energy-Status and Prospects, 1998, ABB Corporate Research Ltd., 1998.
BP, 1998, BP Statistical Review of World Energy, British Petroleum Co. PLC (now BP Amoco PLC), June 1998.
Bruton, et al., 1997, "A study of manufacture at 500 Mwp p.a. of crystalline silicon photovoltaic modules," T.M. Bruton, et al, Proceedings of the 14th European Photovoltaic Solar Energy Conference, 1997.
EIA, 1999, International Energy Outlook 1999, Energy Information Administration, US Department of Energy, 1999.
Nakicenovic, et al., 1998, Global Energy Perspectives, edited by N. Nakicenovic, A. Grubler, and A. McDonald, International Institute for Applied Systems Analysis and the World Energy Council, 1998.
Patterson, 1999. "Transforming Electricity," W. Patterson, 1999.
Strategies Unlimited-data provided in a personal communication from Robert Johnson, Strategies Unlimited.
UCS, 1999, "Powerful Solutions-7 Ways to Switch America to Renewable Electricity," Union of Concerned Scientists, January 1999.
US DOE & EPRI, 1997, "Renewable Energy Technology Characterizations," Office of Utility Technologies, Energy Efficiency, and Renewable Energy, US Department of Energy, and EPRI, December 1997.
Envec 99, Perspectives of Renewable Energy in the Future Energy Supply Photovoltaics Now and in the 21st Century,Michael Pitcher, P Solarex,October 1999.
The author-
Mark Hammonds is global product manager of BP Solarex, a wholly owned subsidiary of BP Amoco PLC based in Sunbury, England. He joined BP Amoco in 1981. After brief stints in the shipping and exploration division, Hammonds has spent the last 14 years in a various roles and locations with the Solar Division of BP Amoco. Assignments have involved project management as well as sales and marketing.
