New seismic to production software offers fast, low-cost evaluations
A new generation of integrated personal computer (PC) software is changing oil company workflows by replacing expensive workstations, eliminating separate software for each step, and significantly reducing manpower requirements.
Many companies spend a significant time in creating geological models ready for simulation. But many of them do not bother with the model because the computer and manpower resources needed for evaluating them are excessive.
This is now changing. New software for creating a model can reduce by a factor of 10-100 the time previously spent on a project. The time to update complex models can be reduced by a factor of 100-1,000. This means savings in the order of weeks and months of man-days.
The most important feature of this new software generation is that it operates on standard PCs. Several vendors have introduced UNIX-based software code that does each of the workflow steps in separate programs on a PC.
Other software, such as TechnoGuide AS' Petrel is a Windows NT-based application that integrates the entire workflow, from seismic interpretation to production technology in one interface.
Applications
A standard PC will suffice to run integrated software with data consisting of 10 gigabytes of seismic, a 3D model, 50 wells including logs, etc. Typically this requires a PC with 128-megabyte RAM (random access memory), 20-gigabyte hard drive, and a graphics card supporting OpenGL graphics language.
This hardware is available for about $2,000.
As more software vendors discover that PCs perform better and more cost effectively than the traditional UNIX workstations, the industry will see more applications coming to the market.
Keywords such as " seismic volume rendering," "volume extraction from seismic," "stochastic and deterministic object modeling," etc. will become common.
The capabilities of Petrel software illustrate the type of integration now becoming available to the industry. This includes:
- Seismic visualization and interpretation.
- Well correlation.
- Fault modeling.
- 3D gridding.
- Depth conversion.
- Facies modeling.
- Petrophysical property modeling.
- Upscaling.
- Volume calculations.
- Well design in 3D.
- Plotting.
Seismic visualization
Software for seismic interpretation on PCs has been available for awhile. Various software vendors have efficient, friendly, and fast tools. Previously, to load the data, however, large amounts of memory had to be available on workstations.
Novel techniques, however, can now run seismic interpretation on PCs with only 128 megabytes of memory, at comparable or superior speeds.
With this new software, real-time rendering of seismic SEG-Y (Society of Exploration Geophysicists recommended standard for digital tape formats) data may be used for quality control of fault planes and surfaces because information for the entire work process is instantly available.
Application of real-time rendering has proved that standard seismic interpretation often carries large errors when not thoroughly checked for consistency.
New software allows immediate 3D interpretation of in-lines, cross-lines, and random-lines. This provides for more-accurate fault modeling and surface generation. Seismic attributes can be quickly constructed for highlighting specific features and slices can be made at any level.
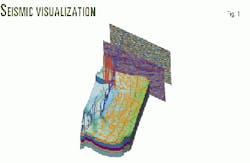
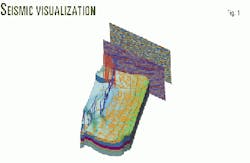
The software includes powerful intersection planes that support texture mapping and allow one to view, slice, and render through the data at any angle in any direction. All structural data can be viewed simultaneously (Fig. 1).
Well correlation
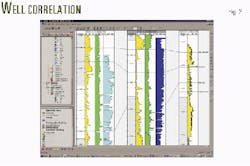
The new software can include models that integrate all information, so that correlations between wells is possible by building numerous well sections. In a section, logs and other kind of well data can be used to construct detailed reservoir zones, as well as to position facies and well tops (Fig. 2).
Integration with the rest of the model accommodates immediate updates of the geological model and its properties.
Well sections can be visualized and correlated in classical 2D views as well as with 3D visualization techniques. Editing can be performed on the well correlation plot and be immediately updated in the 3D view. The 3D view could include the 3D model integrated with seismic, well trajectories, and log information along the well paths.
For producing fields, production data can be imported and visualized for better understanding of the production history.
Fault modeling
Fault modeling has traditionally been the problem area when building geological 3D models. With introduction of the new generation of software, this is no longer the focus. Instead of adding the faults to the unfinished model, the new software starts the modeling by defining the fault properties based on input data. Then the layer properties are added in order to honor the fault properties.
This unique and superior structural modeling introduces faults rapidly and accurately. There are very few restrictions to what can be modeled and most fault geometries can be added. These models can handle reverse, crossing, y, connected, and truncated faults, as well as faults that die out.
In the models, a framework of skeleton grids is built around the modeled faults (Fig. 3). This defines the grid layout and makes it easy to insert the interpreted horizons.
3D gridding
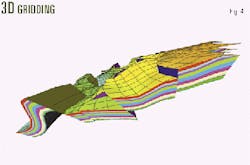
Horizons are constructed inside the 3D skeleton using interpreted data such as seismic lines, points, or gridded maps (Fig. 4). This technique ensures that everything is consistent and honors the relationship between the interpreted horizons and faults.
In essence, the shared earth model is a complete model in which faults and horizons are part of the 3D grid, including traditional 2D maps.Updating a model is easy because all information is within the current model. Simply inserting a new interpretation or new wells into the predefined skeleton grid updates the model.
Depth conversion
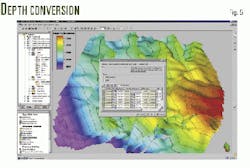
Preserving details from seismic interpretation in time is vital for keeping 3D models structurally consistent (Fig. 5). Problems appear when time structures are converted into depth.
This problem can be solved by depth conversion of the entire corner point 3D grid, node by node.
Subsequently, the details are preserved in an equally consistent depth model, providing that a correct velocity model has been used.
Facies modeling
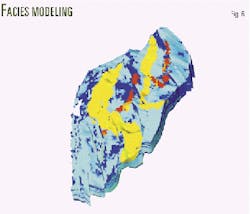
Facies modeling can be performed either as continuous or interactive modeling (Fig. 6).
Oil companies use continuous modeling for stochastic models of discrete properties such as facies. These models have been used for some time and are common. Specific simulation settings attached to individual zones in addition to frequency distribution of the different facies properties are some options incorporated in the analysis.
The new software includes interactive modeling of facies bodies by using old fashioned drawing techniques within the framework of the software. In this procedure, all the old techniques are honored.
The method consists of drawing tools with predefined settings such as brush radius and type, height, profile, and origin. In this way the facies model can be distributed manually based on one's regional geological knowledge.
Petrophysical property modeling
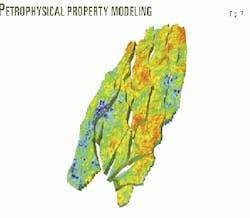
The importance of modeling or distributing well log information in 3D space should not be underestimated. 3D distribution of petrophysical log data is an extremely powerful tool to understand the spatial distribution based on ones actual well data and trends (Fig. 7).
Deterministic and stochastic distributions can be used with or without a relationship to another property, such as facies distribution. Statistics and histograms will highlight the extreme values, which can be edited directly in 3D with filtering techniques.
A scientific calculator provides a flexible way of calculating new properties from zones or a combination of the existing properties.
Upscaling
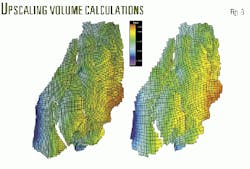
Geological grids reflecting field heterogeneity often contain too many cells for reservoir simulation. The geological grid, therefore, may need to be upscaled to a size manageable by a reservoir simulator (Fig. 8).
In the new generation of software, one can use the same framework as in the geological grid to construct a coarser grid for simulation and upscaling of the vertical layering and properties.
For visualization, the software may also allow for importing results of flow simulations, such as Eclipse RESTART files and INIT files. The visualization allows one to go through the model in time steps (4D) to see how fluids behave in the reservoir over time.
Volume calculations
Traditionally, volume calculations often have been either inaccurate or time-consuming because of the use of separate software modules that created inconsistencies and errors.
With integrated software, hydrocarbon volumes may be calculated using zones, contacts, well-influenced radii, lease boundaries, etc. Because of the high accuracy of structural models, uncertainties in volumes are reduced. In these models, each zone may be given different contact levels in each fault compartment.
Spreadsheet-type format allows for the volumes calculated to be edited and exported. These reports calculate various volumes, such as bulk volume, stock-tank original oil in place, etc. for the entire model or individual segments or zones.
Because the new software generation is based on the Windows environment, all information can be pasted to commercial spreadsheets if additional work is to be performed on the calculated results.
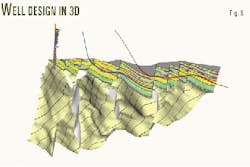
Well design in 3D
In the software, wells are digitized directly in 3D space. Any object displayed in the 3D window can be used as a target for the well trajectory points. One can control the well curvature and export the X, Y, and Z coordinates (Fig. 9).
For new wells, the software constructs synthetic logs and samples petrophysical parameters, such as porosity and permeability, along the planned trajectory.Current available PC graphics cards allow for stereographic viewing on the PC screen at an extremely low cost. Previously this was only available in high-end PC and Unix systems.
Different types of visualization rooms have been a trend in the industry for the last few years. These have proven to be valuable tools, but these rooms are expensive and are not that compatible with operations and immediate decision making.
The new PC software no longer has this limitation. The programs and stereo facilities can be used at the office or at the wellsite.
By introducing measurement-while-drilling (MWD) data into the model, one can combine and evaluate the 3D geological model, the integrated seismic, the planned well trajectory, and the actual well trajectory at the same time.
The operations geologist can now update the formation tops in real time at the well site and make the necessary corrections as drilling progresses.
Plotting
The industry always has had a difficulty of obtaining real-time plots and maps. Often the available software has been incompatible with a company's available plotters and the process often has been slow and difficult to work with. Also, in some cases, specialists were needed for providing the required plots.
This has changed with the new systems running in a Windows environment. Simple cut-and-paste operations can place plots and maps directly into documents. Also, users can access all printers and plotters that are normally available to the PC network and easily output special plots, maps, integrated plots of seismic, 3D model, etc. without have to rely on specialists.
Different parts of the 3D grid can be plotted either as maps or cross-sections. These plots can include horizons, surfaces, and isochors plotted as contoured maps with the associated faults. Any paper size, such as A4 or A3, can be used.
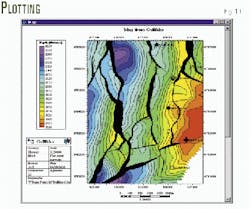
Various parameters and reservoir properties can also be plotted. These can be in the form of skeleton grids, wells, variograms, cross-plots, histograms, and various well correlation sections. Client templates can be imported that include logos, headers, legends, scale bars, and text boxes (Fig. 10).
Plots can be output to any plotter or printer with a Window drivers in such formats as Windows metafiles, CGM, and postscript.
The Authors
Sven A. Vik is senior manager professional assistance for Technoguide AS, Oslo. He formerly worked for Saga Petroleum AS. His oil field experience has mainly involved well testing and analysis. Vik has an MS in chemical engineering from the Norwegian Technical University at Trondheim.
Harald Selseng is reservoir engineering advisor for Technoguide AS, Oslo. He previously worked for Saga Petroleum AS. His experience includes well test interpretation and operations, reservoir simulation studies, and production technology.
Selseng has a BS in natural gas engineering from Salford University, UK.
