DRA for gas pipelining successful in Gulf of Mexico trial
A field trial conducted on a gas pipeline in the Gulf of Mexico on the use of a corrosion inhibitor as natural gas drag reducing agent (DRA) has resulted in peak gas-production rate increases by 10-15% and peak pressure drop decreases of up to 20%.
The pipeline used for this field trial was a 6-in. (152.4 mm) Schedule-80 subsea flowline from Mobile 863A platform to Mobile 864B platform with a total length of approximately 5 miles (8.05 km) in the Gulf of Mexico. A description of the Mobile field follows.
Summarized here are the results of this field trial.
Metal-surface binding
Arco E&P Technology has reported on corrosion inhibitors which can strongly bond to metal surfaces in gas transmission lines and form a smooth film to reduce friction between the flowing gas and pipe wall.1 These corrosion inhibitors can form a film comparable to a thin coating on the pipe inner surface to reduce friction.
The types of corrosion inhibitors used in this application are fatty acids, oxyalkylated fatty acid amines, and/or amide with carbon numbers between 18-54.2
These compounds are effective gas drag reducers because they all have amine functional groups providing strong binding to the metal surface; the long-chain hydrocarbon part serves as a lubricating surface to mitigate turbulence at the gas-solid interface.3
In an attempt to boost the gas production rate cost-effectively, Chevron Petroleum Technology Co., San Ramon, Calif., conducted a field trial at Chevron's Mobile field in the Gulf of Mexico using a commercial corrosion inhibitor similar to that identified in the literature as a gas drag reducer.1
The commercial corrosion inhibitor selected for this field trial is a film-forming corrosion inhibitor often batched in gas pipelines. It is specially formulated to be able to lay a protective film on the internal surface of the pipeline.
The chemistry of the main component is based on polyamido-amines. A well-formed film behaves as a coating on the surface to offer a smoother surface. Consequently, the friction loss can be significantly reduced.
Unlike conventional drag reducing agents, the corrosion inhibitor works differently in reducing friction. Conventional drag reducing agents work by having the chemicals, typically polymer based, dissolved in the fluids and therefore, altering the flowing characteristic of the fluids.
The polymer can absorb the turbulent energy near the fluid-surface interface to reduce the force exerted on the surface. The absorbed energy subsequently dissipates into the bulk fluid to minimize the local fluid turbulence on the pipe wall and consequently reduce the friction.
It is obvious from this mechanism that the conventional drag reducing agents must be injected continuously to keep the fluid property properly adjusted.
The corrosion inhibitor used in this application does not change the fluid property to achieve the drag reducing effect. Instead, it works by directly reducing the surface roughness, and consequently the pressure drop across the pipeline.
This mechanism allows the chemical to be applied periodically in batch, as long as the film is stable on the surface between each treatment. Like all other film-forming inhibitors, this inhibitor exhibits a limited film life on the surface. Once the inhibitor film is lost, the effectiveness of the drag reduction is reduced.
Another batch application must be applied in order to maintain the drag- reduction efficiency. The efficiency of the chemical was measured by monitoring the pressure drop along the pipeline as well as the gas throughput (or flow rate).
Mobile field
Chevron's Mobile field is in the eastern Gulf of Mexico about 15 miles (24.14 km) south of Pascagoula, Mississippi. Water depth is about 60 ft (18.29 m).
Gas is produced from the Norphlet trend, which contains high pressure, high-temperature sour gas. H2S concentration ranges from 60 ppm vol to 1.8%, and CO2 concentrations can be as high as 4.5% for Chevron wells.
The gas also contains diamondoids hydrocarbons (adamantanes, diadamantanes, etc.). Wellhead pressures can exceed 10,000 psig (69 MPa), and temperatures are more than 300° F. (148.9° C.).
Chevron's main facility in this field, Mobile 864B, contains all the processing equipment: three-phase separation, amine and glycol systems, water treating, and utility systems.
Wells are on satellite platforms and flow to the main facility via subsea pipelines. Pipeline lengths vary from 1 to 5 miles. Diesel is pumped from the main facility to the satellite platforms, where it is periodically injected into the flowlines to help dissolve solid hydrocarbons (diamondoids) that may precipitate.
MO 863 A platform hosts one of these satellite wells. The well has a flowing wellhead pressure of about 10,000 psig (69 MPa), temperature of 350° F. (176.7° C.), H2S concentration of 1.8%, and CO2 concentration of 2%. After the choke, the production flows through a static mixer and cooler before entering the departing pipeline.
The pipeline to the main facility is a 6 in. (152.4 mm), Schedule-80 pipeline with a total length about 5 miles. This is the pipeline in which application of drag reducing agent was conducted.
This pipeline carries a production of 42-45 MMscfd (1.189-1.274 million std. cu m/day) of gas and 5 bbl of water/MMscf of gas. The water comes from condensation rather than produced brine. There is no hydrocarbon condensate produced from this well, only gas, water, and solid diamondoids.
The pressure drop along the pipeline is 600-700 psi with no chemical treatment. The physical properties of the fluids are summarized in Table 1.
At the main facility, the production enters a two-phase separator, and the gas is then sent on to a third-party processor, the main facility not having been equipped to process this much H2S. Pressure at the separator on the main facility is maintained at 1,100-1,200 psig, depending on backpressure to the third party.
Pressure at the wellhead downstream of the choke is limited to 1,885 psig due to pressure-safety high (PSH) and pressure-safety valve (PSV) set points. After accounting for pressure drops on the platform, this corresponds to approximately 1,840 psig maximum pressure entering the pipeline. These pressure limitations resulted in a maximum flow rate of approximately 48 MMscfd during optimum conditions.
Temperature also played a role. On a hot day, the cooler at the satellite could not cool the gas as much; therefore, its density was a little lower, which resulted in a slightly higher pressure drop.
Pressure readings were obtained from transmitters, whose signal was routed to a data-collection system at the main facility. The gas from the separator is continually metered with an orifice meter in conjunction with a flow computer. This signal is also routed to the data collection system.
Preparing the line
Since the pipeline is known to have some solid buildup (diamondoids), it was pigged prior to addition of drag reducing agent to clean the line of solids as much as possible. Following are the procedures:
Insert the bare swab pig into the pig launcher at MO 863A and align the pig receiver at MO 864B.- Reduce the gas flow rate to approximately 30 MMscfd to obtain velocity in the desired range.
- Begin pumping diesel into the pipeline at 10 gpm for 5 min. This was done to help dissolve any diamondoids in the line and to help fluidize any solids that the pig would push in front of it.
- Line up the pig launcher and launch the pig. Continue pumping diesel at that rate for 5 min, then reduce it to 1.5 gpm.
- Monitor the MO 863A separator and incoming pig trap to determine when the diesel and pig are being received. The pig should arrive in 25 min. Adjust the gas rate if necessary to ensure that the liquid pumps keep up with the incoming liquid. Try not to shut off the gas rate if possible; it is better to keep the pig moving at all times.
- Measure the OD of the pig and compare it to the original OD. If a significant reduction is noted, repeat Steps 1-6 with another bare swab pig.
- If no significant reduction in OD is noted, repeat Steps 1-6 with pigs in the following order: reduced-size red bare squeegee pig; full-size red bare squeegee pig; full-size crisscross pig. After the crisscross pig, the amount of solids received should be minimal.
- Shut off the diesel flow to MO 863A.
- Increase the gas rate to the maximum rate, approximately 45 MMscfd at the time.
- Increase the normal water-based corrosion inhibitor rate at MO 863A to 12 gpd to minimize FeS production and formation before applying the drag-reducing agent.
- Monitor the pressure drop in the pipeline for 24-48 hr after the pigging is complete to determine if pigging the line reduced the pressure drop.
Chemical application
The chemical was pumped into the pipeline between two diesel slugs. Diesel served two purposes: to help dissolve any diamondoids that may be scrubbed off the line by the pig and to act as a solvent for the chemical.
Diesel was pumped for 5 min before and 5 min after the pig and the chemical were launched. The amount of chemical used was 20 gal, which was limited by the holding capacity of the pig trap.
It would have been better to run the chemical between two pigs to form a true batch treatment, but the pig trap was not set up to do that. The same procedures were repeated twice within 1 hr to complete the batch process.
The batch process was repeated at a frequency of every 3 to 4 weeks to keep the desired high throughput.
The drag reducing effect was beginning to wear off prior to the next batch treatment as indicated by the decreased throughput. Nevertheless, the throughput was still higher than the original level without any chemical treatment.
The efficiency of chemical was measured by monitoring the pressure drop along the pipeline as well as the gas throughput. The overall pressure drop was usually near maximum due to PSH/PSV settings at the satellite. Thus, the flow rate was simply lowered as the treatment wore off.
Periodically, diesel was injected at the wellhead to dissolve any diamondoids that may have precipitated out in the wellhead cooler and pipeline. The diesel treatment was typically carried out for 6 hr at a rate of 3 gpm every other day.
It was observed that the periodic diesel treatment contributed to higher pressure drop readings and, consequently, lower flow rates. This may result from the temporary instability of the film as caused by the presence of diesel. This could also have been caused by the increase in fluid that was in the line.
The amount of condensed water was about 250 b/d at maximum gas rates. The amount of diesel injected was significant: equivalent to about 100 b/d.
Results
The test period extended to nearly 2,000 hr and included four batch treatments of the DRA.
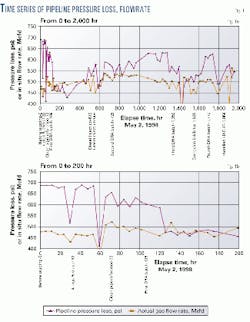
Fig. 1a shows the time series of data collected on pipeline pressure loss and flow rate during the entire DRA test. Although during the test, it appeared that the DRA was having a positive effect, it was difficult to quantify the amount of improvement because of the transient nature of the flow and the continuous deposition of diamondoids.
The main events recorded by operators in the field are also shown below the X-axis at approximately the time of their occurrence. After the first DRA treatment (approximately 108 hr), the pressure loss was reduced dramatically, but the flow rate also reduced, clouding the performance issue.
An expansion of the time series from 0 to 200 hr (Fig. 1b) shows a little more clearly the effect of the first DRA treatment.
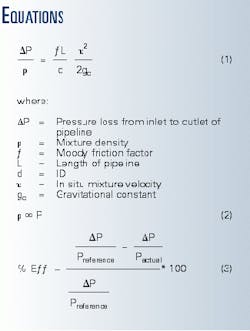
A standard frictional pressure-loss relationship (Equation 1 in the accompanying box) was used to characterize the pipeline performance as a function of mixture properties, mixture flow rate, and pipe diameter and roughness.4 5
The Jain equation was used to predict the friction factor as a function of Reynolds number and wall roughness. For a gas-dominated mixture with constant properties at a constant temperature, the density is proportional to pressure.
Therefore, fluctuations in performance (due to changes in flow rate and pressure) can be reduced by plotting the nondimensional pressure loss (DP/P) vs. actual gas flow rate. In this study, the average pipeline pressure (Psys) was used to non-dimensionalize the pressure loss.
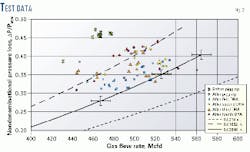
Fig. 2 shows the test data of DP/Psys plotted against the actual gas flow rate for the following test periods:
- Original pipeline condition before pigging or DRA application.
- Pipeline condition after pigging but before the first DRA application.
- After the first and subsequent DRA applications.
The solid and intermittent lines in Fig. 2 show the performance predicted from Equation 1 for different absolute roughnesses and original pipe diameter. Reduced diameters due to the deposition of the diamondoids were also investigated but are not included in this report because choice of diameter did not affect the magnitude of the performance improvement.
The dotted line at the lower right of the graph is the performance for a new 6-in., Schedule 80, commercial steel pipe of 5.761 in. ID and 0.0018 in. absolute roughness.
As can be seen from Fig. 2, the pipeline never returned to its pristine condition during any part of the testing. This seems to be good evidence that there was a fairly thick diamondoid residue left on the pipe even after pigging and diesel flushes. The residue was estimated to be of the order of 1 mm thick.
The continuous deposition of diamondoids caused the pipeline performance to change with time and could overshadow the effect of DRA. Comparing pipeline performance immediately after pigging, however, permits evaluation of pipeline performance with and without DRA in nearly identical pipeline conditions.
The uppermost dashed line represents the pipeline performance immediately after multiple pigs and diesel flushes but before continuous diamondoid deposition could have a pronounced effect. This line represents the best performance the pipeline could achieve prior to DRA application.
An absolute roughness of 0.01632 in. was used in Equation 1 to force the dashed line to pass through the highest performance data point, which occurred immediately after pigging was completed. The symbol (+) for the highest performance data point used in this match has been enlarged (Fig. 2). This line forms the baseline performance for the pipeline without DRA.
The solid line, toward the middle of the graph, was forced to pass through the highest performance data immediately after the first DRA application by an adjustment of the absolute roughness to 0.00648 in.
The vertical error bars, generated for water condensate ratios of 0-10 bbl/MMscf, indicate the uncertainty in pressure loss due to unknown quantities of liquids (condensed water and injected diesel) flowing in the line. The horizontal error bars represent the uncertainty in gas flow rate due to fluctuations in pipeline system temperature of
The area in Fig. 2 between the upper dashed line and the solid line is the region of improved pipeline performance due to DRA. It can be seen that except for a few anomalies the pipeline performance after DRA application was consistently better than performance before DRA.
Data points to the left of either reference line indicate a deteriorating pipeline performance and appear to result from the deposition of diamondoids.
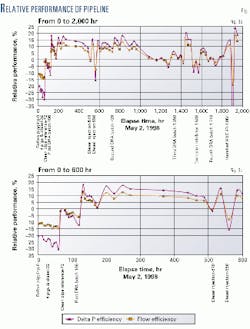
Equation 3 determines the pipeline pressure-loss performance relative to the best pre-DRA performance (Figs. 3a and 3b). The nondimensional pressure loss is calculated at the same flow rate as the actual observed flow (equivalent to moving horizontally to the dashed line in Fig. 2).
An alternative but similar approach to characterizing performance improvement is to calculate the percent increase in gas throughput for the same non-dimensional pressure loss (equivalent to moving vertically to the dashed line in Fig. 2).
Figs. 3a and 3b show both performance characterizations. Fig. 3a shows the entire 2,000-hr time series; Fig. 3b shows the time series before and after the first DRA application (0-600 hr).
The following observations can be made from these plots:
- Immediately after application of the DRA, the pressure-drop performance improves approximately 15-20%, and the gas throughput improves 10-15%.
- Pipeline hydraulic performance shows significant deterioration during the following intervals: 0-60, 70-120, and 130-170 hr.
This decrease in performance, most obvious following a pigging sequence, is due to continued deposition of diamondoids on the pipe wall.
- Pigging the line and flushing with diesel seem to return the line to nearly top performance (500 hr), but subsequent pigging and diesel injection do not further improve performance (540 hr).
These data suggest that, absent deposition, the DRA effectiveness might last on the order of 400 hr in this field test.
- Diamondoid sloughing after build-up may be occurring as indicated by performance cycling following DRA application. This is most evident following the first injection at 170 to 250 hr.
Sparse data prevented the drawing of any firm conclusions, but one can imagine deposition dunes building up to the point where the pressure drop across the dune is finally sufficient to break down the blockage, significantly reducing the pressure loss and returning closely to pre-dune performance.
Although continuous deposition of diamondoids overshadowed any deterioration in DRA performance, it seems that batch treatments of DRA are capable of maintaining their effectiveness for at least 400 hr.
Acknowledgments
The authors would like to thank Chevron USA, Chevron Petroleum Technology Co., and Chevron Overseas Petroleum Inc. for supporting this project and granting permission to publish and Nalco/Exxon its contribution.
References
- Ying-Hsiao Li, Chesnut, G.R., Richmond, R.D., Beer, G.L., and Caldarera, V.P., SPE Production & Facilities, February 1998, pp. 53-58.
- Ying-Hsiao Li, "Drag Reduction Method for Gas Pipelines," U.S. Patent 5,020,561, June 4, 1991.
- Blick, E.F., "The Theory of Skin Friction Reduction by a Compliant Coating in a Turbulent Boundary Layer," University of Oklahoma, U.S. Army Research Office, Contract DA-31-124-ARO-D-349, 1968.
- Jain, A.K., "An Accurate Explicit Equation for Friction Factor," J. Hydraulics Division (May 1976) Vol. 102, p. 694.
- Brill, J.P., and Beggs, H.D., "Two-Phase Flow in Pipes," University of Tulsa, Dec. 3, 1978.
The authors-
Huey J. Chen is a staff research scientist in Chevron Petroleum Technology Co. and a member of CPTC's Flow Assurance Team. She received her BS in chemistry from National Taiwan Normal University, Taiwan, and PhD in physical organic chemistry from Illinois Institute of Technology, Chicago. She currently holds memberships in ACS and NACE International.
Gene E. Kouba is a staff research scientist in Chevron Petroleum Technology Co. and a member of CPTC's subsea concepts team. Kouba received BS and MS degrees in mechanical engineering from Oklahoma State University, Stillwater, and holds a PhD in petroleum engineering from the University of Tulsa. He is a member of SPE, ASME, and Sigma Xi.
Michael S. Fouchi is a senior process engineer with Chevron Overseas Petroleum Inc. in Nigeria. He holds BS (1991) in chemical engineering from Texas A&M University and is currently a member of AIChE.
Bob Fu is a staff scientist for Nalco/Exxon Energy Chemicals LP, Sugar Land, Tex.. He has 10 years' experience in oilfield production chemical technologies with Nalco and Nalco/Exxon. He holds a BS in chemical engineering from the National Tsing Hua University, Taiwan, and a PhD in chemistry from Texas A&M University. Fu is a member of SPE and NACE International.
Daniel G. Rey is the worldwide product manager for corrosion inhibitors with the oil field chemical group of Nalco/Exxon Energy Chemicals LP, Sugar Land, Tex., and has been with the company nearly 8 years. He holds a BS in industrial distribution from Texas A&M University and has been a NACE member since 1994.


