Determining incremental refining yields can reduce runs, increase profits
Most refiners would have higher profits if they reduced crude runs. This is particularly true when refinery profit margins are small or negative.
Although incremental crude barrels do not have to cover refinery-base expenses, sometimes the yields on incremental barrels are so poor that they do not even cover the cost of the crude oil itself.
The "shadow value" incremental economics from the refinery linear programming (LP) model is not an accurate measure of the real value of the next barrel of crude oil processed. It mistakenly assumes that the incremental yields for any unit are the same as that for average yields.
Refinery economists often use average yields as incremental yields because they are at least a couple of orders of magnitude easier to calculate. Refiners often do not know how low throughput rates should be because they do not know their incremental yields and rate effects on market prices.
Accurately determining incremental yields requires the collection of much statistical data.
It is worth determining incremental yields, however, because they can be used to avoid processing barrels that lose money.
Incremental alkylation production
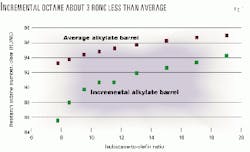
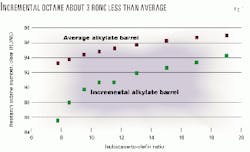
In refinery-model equations with built-in incremental economics, the last increments of alkylate production have 3+ octane numbers lower than the average alkylate.
Refinery economists can verify this in the following way: Assume that the isobutane recycle does not change with the alkylate production rate. Thus, adding olefin feedstock to the unit slightly lowers the isobutane-to-olefin ratio.
Refer to the isobutane-to-olefin vs. alkylate octane curve to find the slope of the curve the appropriate isobutane-to-olefin ratio (Fig. 1). The octane of the entire alkylate production will be slightly lower because the ratio changes when more alkylate is produced.
If one assumes that the lower octane in the incremental alkylate production reduced the octane rating in the whole pool, the incremental alkylate must have an octane rating 3+ numbers lower than normal production.
If this kind of change of octane for incremental alkylate is not built into the refinery LP model, the model is wrong, and the model probably does not account for incremental yields for the other units either.
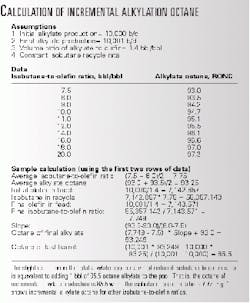
The sample calculation in the accompanying box shows how to calculate the octane of incremental alkylate. The data in the box are based on a refinery LP model that was modified to create a new alkylation unit of 1 b/d. The octane of the alkylate produced from this 1-b/d aklyation unit represents the octane of the incremental alkylate.
The feedstock to this incremental alkylation unit should be refinery-like akylation unit feedstock, available at the price for which it could be sold. The alkylate product would be another stream to gasoline blending.
When the LP model chooses not to make a potential alkylate, the feed rate to the refinery alkylation unit should be reduced, and the excess feedstock should be sold.
Fluid catalytic cracking units
The values of the yields of the last 2% increment of fluid catalytic cracking unit (FCCU) feedstock is about 3¢/gal less than average yields. This estimate is based on many months of daily yields from Citgo Petroleum Corp.'s, Corpus Christi, Tex., 60,000-b/d unit.
It is necessary statistically to analyze an appropriate mass of data to get a respectable estimate for incremental yields. It is incorrect to calculate the value of incremental yields based on a limited number of test runs.
For example, a calculated difference of 11¢/gal based on two test runs is insufficient information. An FCCU does not run consistently enough for conclusions to be drawn from data from merely any two test runs.
The result of KBC Advanced Technologies plc's Profimatics FCCU reactor-kinetics model supports the lower value of incremental yields. If allowed to select the feed rate for product values that are modestly profitable on average, the optimizer will select a feed rate that is less than maximum.
That is, the last incremental product of the selected feed rate is barely profitable, and the next one loses money.
It is probable that no refiner has ever cut the feed rate to the FCCU based on that result, however. But possibly, the refiner should.
The author knows of no instance in which the operator has recorded incremental FCCU yields based on a real unit to test the Profimatics results, and thus the results should be used judiciously. Profimatics results are better, however, than results from assuming that the incremental yields are the same as average yields.
Having studied the value of yields from an FCCU for a few hundred days with a constant set of prices, the author noticed that there was considerable variation in the total daily profit for the unit.
Much of the variation was the result of the gravity of the feedstock that was used. For the FCCU calculations, the engineers should have normalized the weight balance by changing the gravity of the feedstock rather than changing the feed rate. Had this occurred, the results would have been more consistent.
The laboratory was running the gravity of the FCCU feedstock once a day, while the FCCU-feed components from the crude unit were being run once per shift. The differences between consecutive examples were as much as 0.5° API.
The point is that daily gravities may not indicate the daily average gravity of the feedstock, but normalized results are very sensitive to the gravity being used. Continuous online gravity results would be nice. Among other units, cokers should be particularly sensitive to feedstock gravity in this same way.
Crude units
The following two crude-unit case studies show examples in which the values of incremental yields are less than that of average yields. The processing of extra crude oil could not be justified for either crude units.
The values of all the crude-unit fractions are roughly the same except for that of the vacuum tower bottoms (VTBs). VTB yields can determine the incremental economics on a crude unit.
In 1969, Signal Oil and Gas Co., Houston, (later named Charter Oil, Hill Petroleum, Phibros, and Valero) cut back its crude processing from its normal 130,000 b/d to 117,000 b/d.
For comparative purposes, the author selected periods of time when the crude slates were similar and created a calculated distillation curve for combined slates based on standard assays of the involved crudes.
The calculated yields of the incremental 33,000 b/d were worth 25¢/bbl less than the yields of the 117,000 b/d. The difference was mostly as a result of production of a greater fraction of VTBs in the increment.
At that time, crude prices were much lower. For the last 1% of yields, the loss in product value was assumed to be at least twice that, or 50¢/bbl.
In July 1995, the Fina Oil Co. refinery in Port Arthur, Tex., cut its crude unit from about 137,000 b/d to 130,000 b/d for about a month. The author searched the data for periods at high and low rates where the crude slate was very similar. Eventually, the author studied periods of 4 consecutive days at each rate.
During this month, VTBs production moved from 14.5% to 13.0%. This change was not noticeable in a plant of constantly changing crude slates. It meant, however, that the production of VTBs was 3,000 b/d less when the crude rate was reduced by 7,000 b/d.
In effect, there was a 42% yield of VTBs on the incremental crude. Because the coker and UOP Demex solvent-extraction units were both full at the crude rate of 137,000 b/d, those extra VTBs went straight to No. 6 fuel blending. The products from the incremental crude rate were worth $30,000/day less than the cost of the crude oil.
Despite corrections for the small differences in the crude slate and in the crude-heater outlet temperature, the value loss at higher rates was real. Both periods were during good summer weather, 20 days apart. The lower rates came after the higher rates so that deterioration in unit performance cannot be blamed for the production of more VTBs at higher rates.
A simulation of the unit based on the original yield periods showed that the value losses were a result of sloppy, random operation of the crude unit. It turned out that the overflash control indication had been lost several years before, and it had not been fixed in subsequent shutdowns. Thus, a random amount of reflux had been flushed down into the atmospheric tower bottoms for years.
The overhead condensers were fin-fan exchangers, and the pressure drops across these were sensitive to the rates going through them. There were high top reflux rates at the high crude rates.
The pressure at the top of the atmospheric tower was higher during the period of high rates. Therefore, the pressure at the bottom of the atmospheric tower was higher during high rates, and a lower fraction of the crude oil was flashed there even though the heater outlet temperatures were about the same.
The vacuum tower was not capable of recovering all of the extra reflux material from the atmospheric tower. Both problems tended to worsen at high rates.
Arguments against incremental values
The conventional wisdom for refineries is that there is roughly a $3/bbl margin built into crude oil prices. The base load of crude oil has to cover all refinery expenses, which average about $3/bbl of crude processed. Incremental crude rates do not have to cover all refinery expenses, however.
Costs such as wages, insurance, and capital costs do not increase as crude rates go up, and the cost of incremental utilities is probably negligible.
Thus, the refinery will still profit from the extra crude oil if the value of the incremental crude rate is worth $3/bbl less than that of the average crude rate. The assumption that the value of the extra crude rate does cover that extra $3 margin should be challenged, however.
In the above crude unit examples, the additional crude rates do not cover the $3 advantage. Increased rates actually reduced refinery profits. This is likely a common event. It is not known for any given refinery whether the extra crude rate covers its cost.
In the very recent past, the price of crude oil has gone from $10/bbl to $30/bbl because OPEC cut its production from 25 to 20 million b/d. Worldwide production went from 75 million b/d to 70 million b/d, or 6.9%.
Note that OPEC revenues went from $250 million/day to $600 million by cutting crude oil production.
Likewise, if refiners had cut their crude run instead of OPEC cutting production, the effect on product prices would have been the same: higher gasoline prices at the pump.
In spite of the $3/bbl advantage of incremental crude over base load crude, incremental crude is not profitable. It tends to reduce the value of product prices in the market and to make below-average yields on the crude.
Unless margins on crude oil are very good, there is negative incentive to run incremental crude.
The value of incremental crude rate to a refinery depends on many things, some of the more obvious being:
- The crude-oil buyer tends to pay more for the last increment of crude oil purchased.
- The market price for all crude tends to go up as more crude is purchased (100% of crude run).
- There are more oil tanker demurrage charges as crude rates go up because of scheduling difficulties.
- A larger percentage of VTBs is made in the crude unit as rates go up.
- The incremental yields from alkylation, FCCUs, and cokers are less valuable than average yields. Reformer incremental yields may be also worth less.
- Shutdown and other outages are more frequent because of heavy use, or the average condition of the unit is poorer.
- Workers are less efficient as they work harder to keep rates up.
- Product salesmen tend to get less for the last increment.
- Product markets tend to sag as more product is brought into the market.
Determining incremental yields
Unit-modeling software generally do not predict incremental yields well because they were not specifically built for such use.
The results of such software cannot even be tested because no one has any incremental yields from real units with which to test them. These are probably the best tools with which to obtain quick estimations of incremental yields, however.
A few test runs are not the answer either because refinery operations do not appear to be repeatable enough, because of variable factors such as feedstock and weather, to give comparable results.
The best way to determine the value of incremental yields for most units is to alternate feed rates between 95% and 100% of the normal operating rate for alternate weeks. The refinery should collect enough data to perform a statistical analysis for reasonable estimates of the incremental yields.
The refinery LP model will use incremental product or component yields with whatever prices are being considered. Once it can be shown that some rate less than maximum is better than maximum, it is relatively easy to convince management to alternate changes between, for example, 92% and 96% of unit maximum.
It is often difficult to get the refinery to reduce rates even if there is considerable evidence that high rates lose money.
For crude units, the well-equipped refinery laboratory presents an interesting alternative. A plant laboratory can process a daily sample of crude oil for GC (gas chromatograph) results.
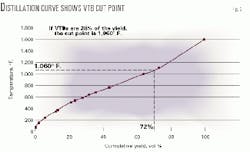
The refinery can determine the VTB cut point by applying the volume percent of VTBs actually produced to the simulated distillation curve produced by the GC (Fig. 2.). Typically, the result will be about 1,000° F.
Plotting the daily VTB cut points vs. different crude rates to estimate how the VTB cut point changes with crude rate. The VTB cut-point temperature change is a measure of increased VTB yields.
LP models can use incremental yields on incremental crude to decide whether the use of incremental crude oil is advisable. Note that a 1° F. change in cut point for a 5% change in feed rate means that the incremental material had a 20° F. different cut point. A 20° F. change in cut point typically means a 2% change in volume.
If there is a $10/bbl differential between crude oil price and VTB value, the 2% volume change is a 20¢/bbl loss in value for the incremental crude oil.
The Author
David Petkus has worked for 37 years in the downstream oil industry. Most recently, he worked for Coastal Corp. in Houston as a senior process engineer in the technology and business development department. He holds a BS and MS in chemical engineering from Purdue University, West Lafayette, Ind.


