Pipeline design to MAOP rating can skew project economics
Francis K. Yip
PipeSim Engineering
Sugar Land, Tex.
Designing pipeline systems solely on American National Standards Institute (ANSI) specifications gives too little consideration to dynamic market conditions and projects' cost variations.
Although the approach simplifies the selection process and yields a conservative design, the economic results can be detrimental.
In what is known as the "death spiral," the high transportation rates produced from an over-sized, poorly configured system result in lower demand which then leads to higher transportation rates in the future, which further suppresses transportation volumes and ultimately diminishes the project's value.
Conservative approach
According to ASME/ANSI B16.5 specifications, a pipeline's operating pressure must not exceed the specified stress limits of valves and fittings used in the system.
The allowable working-pressure limits vary slightly with operating temperature and type of fitting materials for a certain class of pressure rating. They are typically specified as shown in the accompanying box for moderate operating temperatures.
Once the operating class of a pipeline system is chosen, the pipe-wall thickness can be determined by the following formula recommended by ASME/ANSI B31.4:
t = Pi D / (1.44 S)
where:
t = Pipe wall thickness
Pi = Maximum allowable operating pressure (MAOP)
D = Pipe OD
S = Specified minimum yield strength (SMYS) of the pipe
The ANSI method of design requires that MAOP match the working pressure of the ANSI rating shown in the box and that the pipe diameter must also meet throughput requirements.
Pipelines are rarely operated at maximum operating limits, even without corrosion, erosion, or other operational problems. These unused capacities mean that millions of dollars invested in pipelines are lost annually.
Consequently, consumers have to carry these unnecessarily huge transportation costs for decades. In some cases these high rates result in the pipeline being shutdown.
Following are the most frequent causes of pipeline over-sizing:
- Failure to project future demand for products delivered through a pipeline.
- Inadequate hydraulic analysis.
- Improper selection and installation of pumps and compressors.
- Lack of material and construction data.
Clearly, planning a pipeline successfully with the lowest uncertainty with respect to the above factors is extremely complex. It is highly time-consuming and requires fast and accurate determination of pipeline system requirements.
Modern software, keen engineering talent, and common sense can lead to an efficient pipeline system that accurately reflects all market, labor, and material conditions.
This article, by using results of a recently completed pipeline feasibility study, demonstrates why a conventional MAOP pipeline system is not optimal.
Products pipeline study
The objective of the study was to find the most economic pipeline system to transport refined products 250 miles from an existing tank farm to a terminal. Terrain of the pipeline route is relatively flat with little change in elevation. The distances between pump stations are almost equal.
Refined products transported consist of gasoline, fuel oil, and jet fuel with typical physical properties shown in the accompanying box.
These products are delivered through the pipeline in batches at a cycle of approximately 3 days. Normally, the batch cycle is a function of available storage space, interface contaminations, and throughput requirements.
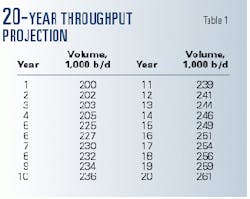
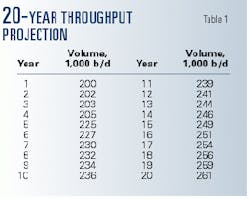
Daily delivery of these products increases each year (Table 1).
Four existing pump stations could be utilized if required. Additional pumps will be installed at some of these locations, depending on the size of pipeline system finally selected.
Petroleum products are stored in tanks at the tank farm near the first pump station, which will be equipped with four additional booster pumps and four mainline pumps. Other pump stations will have the same number of mainline pumps, to be driven by electric motors.
Comparison
Based on conventional specification, ANSI Class 600, the MAOP of the pipeline system will be 1,480 psig. In this case, the pipeline must be designed to withstand the allowable stress of the pipe in accordance with the ASME/ANSI B31.4 code.
Hydraulic analyses were performed by the author in 1999 using a commercial hydraulic simulation software for a client in Texas on a range of pipe sizes based on the throughput projection of Table 1, and several iterations of the wall thickness were made using the equation given previously.
This process resulted in pipe size and pump-horsepower requirements.
The same process was followed to optimize the pipeline design using a lower MAOP for the pipeline system, and hence thinner wall thickness. Table 2 shows both ANSI and optimized design selections that meet Table 1 throughput requirements.
The 20-in. pipeline system tabulated in Table 2 cannot meet ANSI Class 600 specifications using four pump stations for both cases and must be designed to meet Class 900 specifications. This would require more expensive pumps, valves, and fitting, and therefore make the system uneconomic.
Net present values of the alternative pipeline system's costs consist of material and installation of the pipeline, pumps, valves and fittings, scraper traps, supervisory control and data acquisition (SCADA), right-of-way, taxes, and operating and maintenance (O&M) expenses over 20 years.
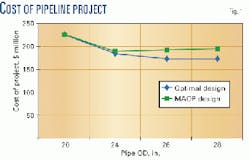
The results are presented in Fig. 1 for two different design cases.
Fig. 1 shows that the 20-in. pipeline system is the most expensive option, with a price tag exceeding $200 million. This is due to substantial increases in pump and electricity costs.
The cost of a 24-in. pipeline system is shown to decline significantly and, among the conventional design cases, is the least expensive choice.
On the other hand, the optimized design approach found that the 26-in. pipeline system is the optimum option, although its MAOP is 1,123 psig. In this case the pipeline, pump, and operating costs are perfectly balanced.
Further increase in pipe size weighs heavily toward pipe cost and resulted in larger capital outlays for the project. Although the 24 and 26-in. pipeline systems are the least-cost options based on two different design approaches, the larger 26-in. pipeline system is clearly a better choice with the total cost of the project at about $8 million less.
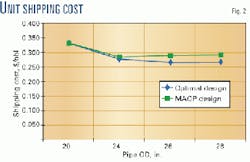
Fig. 2 presents, for the range of pipe sizes discussed, another essential economic parameter, the cost of shipping 1 bbl of petroleum products over the entire distance of the pipeline.
The cost-diameter relationship has characteristics similar to those shown in Fig. 1, lower costs at 24 and 26-in., respectively, for conventional and optimized design cases.
Various economic parameters for the two least-cost pipeline options are compared in Table 3.
Although the 24-in. pipeline system has a lower pipeline capital cost, its overall cost is still higher than that of the 26-in. system. Comparison of such costs as power consumption, O&M, and shipping clearly favors the 26-in. system. Its larger capacity makes this choice even more attractive.
Ramifications
In 1998, approximately 157,000 miles of liquid pipeline operated in US federally regulated interstate service (OGJ, Aug. 23, 1999, p. 45). If they were designed merely to meet ANSI specification, the cost of shipping liquid hydrocarbons through these pipelines could exceed $750 million annually.
Including another 196,500 miles of operating gas pipelines in this country, the extra cost of transportation to be borne by the consumers could be staggering if design of those lines was not optimized.
Obviously, not all pipelines were designed without due consideration of changing market conditions. The example presented in this paper emphasizes the importance of performing a thorough market and cost-impact analysis.
With increased computing power, improved software, and better application of the technology through extensive expertise, the returns to improved pipeline design are significant, and the detrimental effects of the "death spiral" are greatly reduced.
The author-
Francis Yip is a pipeline hydraulic engineering consultant for PipeSim Engineering, Sugar Land, Tex. He began his career in 1969 with Nova Corp., Calgary, joining Foothills Pipeline (Yukon), a subsidiary of Nova, in 1974. In 1979-1991, he worked for Gulf Canada Resources, Fluor Daniel, RJBrown, and Williams Bros. Engineering Co., all as senior project or pipeline engineer. In 1991-1994, Yip was a project engineer for Saudi Aramco in Saudi Arabia, and 1996-1999 he was a principal engineer for Gulf Interstate Engineering Co., Houston. Yip holds a BSc in engineering physics from Dalhousie University, Halifax, and MSc and PhD degrees in mechanical engineering from the University of Calgary. He is a registered professional engineer in Texas, Alberta, and Saskatchewan.


