Petrophysical insights contradict Archie's equation
Laboratory and industry-based evidence shows that recovered waters from hydrocarbon-filled formations may have higher resistivity levels than those found in nearby water-filled formations.
If true, this would indicate that the Archie equation, used to evaluate hydrocarbon saturation, is invalid.
In essence, some water samples recovered from clean hydrocarbon-filled sands by downhole formation and surface production tests have observed much lower water salinity values than formation waters or mud filtrates. Additionally, some production problems have been associated with water production with below normal salinity.1
These observations contradict conventional belief that the salinities of formation water in hydrocarbon-filled and nearby water-filled sands are identical.
Evidence
Two phenomena cause these produced waters to have a lower salinity than nearby water sands.
First, the formation waters in the hydrocarbon-filled portion of a sand have become isolated from waters of nearby water sands. Thus, hydrocarbons prevent water from commingling in the hydrocarbon and water-filled portions of the sand, and low-salinity water is created by the same phenomenon that preserves primary porosity once hydrocarbons have filled a reservoir. 2-7
This phenomenon, which is described as a "passive reaction," causes the chemical composition of the water (including salinity) in the hydrocarbon-filled portion of the sand to remain constant as the formations become more deeply buried. The earlier such hydrocarbons migrate into a reservoir, the more pronounced becomes the difference between the salinity of hydrocarbon-filled and nearby water-filled sands.
The second reason for water production with reduced salinity is that liquid hydrocarbons have an affinity for salts in adjacent waters. This phenomenon reduces the salinity of adjacent waters as the formation becomes more deeply buried-described as an "active reaction."
Dry gas has little if any affinity for dissolved solids in adjacent waters. Therefore, the change in salinity exhibited between altered (low-salinity water) and unaltered (water in nearby water sands) formation waters in a gas-bearing sand will be created by the passive reaction of water isolation.
Both active and passive reactions affect altered formation waters in oil or condensate-filled reservoirs and typically contain a lower-salinity concentration than gas-filled reservoirs (see box: Passive and active reactions).
A gas-filled reservoir may also contain lower salinity waters than liquid hydrocarbon-filled reservoirs only when the gas-filled reservoir is filled much earlier (geologically) than the oil-filled reservoir.
This article assumes the salinity of formation water in water sands increases as the formation becomes more deeply buried.
Salt absorption
The presence of salt in crude oil can be seen in laboratory tests in which all water within the crude has been removed by centrifugal forces. Physical examination of this water-free crude has revealed microcrystalline salt occurrences in the oil.
This provides the first evidence that hydrocarbons have an affinity for salt and shows why water salinity within oil-filled reservoirs will be different than that of nearby water sands. This difference in water salinity between hydrocarbon and water-filled sands can be explained as follows.
First, visualize a water sand of constant salinity that has become partially filled with oil. Given sufficient time, the oil captures a portion of the salt from the adjacent brine, and the water in immediate contact with the oil then produces a different salinity than the original brine.
These changes in water salinity occur independently of what occurs in the aquifer water over the same period of time. Basically, this contradicts modern petrophysical theory that the water salinity of hydrocarbon-filled and nearby water-filled formations must be identical.
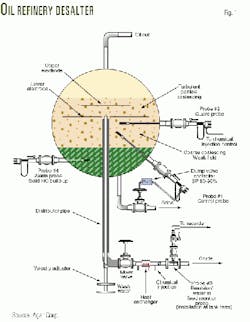
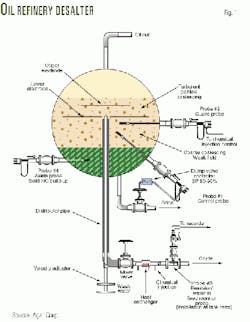
Fig. 1 shows a desalter used in oil refining that provides evidence of this phenomenon. The process of desalting oil is as follows:8
- Thoroughly mix (emulsify) crude oil with fresh water and chemicals. The fresh water, chemicals, and salt contained in the oil then combine.
- Subject the emulsion of salty water and oil to a large voltage.
- The large electric voltage enhances the ability of the water molecules to combine into large droplets. Subsequently, water droplets sink to the bottom of the tank.
- Remove desalted oil from the top of the tank and the salty water from the bottom of the tank.
The crude oil discussed in Fig. 1 has been dewatered before the desalting begins. It can be seen, therefore, that the primary reason oil is subjected to the above process is to remove salt and not water.
If all salts are contained within brine, refiners would merely dewater oil and not incur the unnecessary expense of adding and then removing inessential water.
This confirms that the salinity of waters within hydrocarbon and nearby water-filled formations is not identical.
Laboratory tests
Data taken from the Gulf of Mexico, discussed later in Example 3, show possible evidence that hydrocarbons can extract salts from water in less than 2 weeks. To test this hypothesis, a sample of unaltered water, placed in a jug with condensate and shaken vigorously for 5 min some eight to ten times a day for 1 month, was found to retain its original salinity.
This simple experiment shows that water salinity is not easily altered. Additionally, any test that could confirm this phenomenon will most likely be very time consuming and expensive: It is probable that the time required to reduce the salinity of water may be on the order of tens of hundreds to hundreds of thousands of years.
Four well-production histories are presented as further evidence that hydrocarbons modify adjacent waters.
Multiformation waters
It appears that the only requirement needed to produce differing water salinities in hydrocarbon-filled formations, as compared to that of nearby water sands, is that the water and hydrocarbon phases remain in close contact for an extended time.
There are three types of water that may be in immediate contact with hydrocarbons: connate water, free shale water or the additional water that is not an integral part of dry shale, and mud filtrate. Different downhole conditions must exist for these waters to be produced.
Altered connate water
Low-salinity waters, produced from a gas sand, are currently assumed to be waters bound to the gas molecule-a result of formation pressure.9 To illustrate true connate-water production, instead of an example of this well known phenomenon, Example 1 has been selected because the perforated interval did not produce water during initial production.
Low-salinity water production should demand the answer to a very important question: What is the source of this low-salinity water? Waters of condensation contain no impurities, although these waters exist outside the pipeline and cannot mix with waters inside the highly pressured system.
The belief that low-salinity water, produced from gas sands, is water that has been liberated from the gas as a result of decreased pressure is correct. This water, when combined with the gas, has an identical salinity as the altered connate water in the gas sand. They are in fact one and the same.
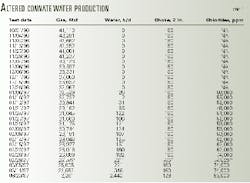
Table 1 illustrates gas and water production from a thick clean sand in the Gulf of Mexico from Oct. 31, 1996, to Aug. 20, 1997. The sand, which has a strong water drive, was produced through 27/8-in. tubing with no choke. The following is an explanation of what occurred downhole.
Initially, the interval produced gas with no water production until Jan. 1, 1997, where no abnormal effects of the high production rate can be seen, although gas production decreased by 8.6 MMcfd.
From Jan. 6 to Feb. 9, 1997, the interval then began to produce water containing chloride concentrations much lower than unaltered formation water, as shown by log analysis and water production from offset wells.
This connate water came from the hydrocarbon-filled interval and was produced when in situ conditions became unstable. Unstable water production is altered connate or altered free shale water produced from the hydrocarbon-filled portion of the sand as a result of significantly reduced formation pressure.
On the other hand, stable water production is unaltered water produced in a formation with a strong water drive in a nearly constant pressure environment.
As the altered connate water moved laterally from the higher formation pressure area towards the borehole, it increased in thickness as formation pressure became smaller.
The increased water thickness, in combination with large produced gas volumes, created the instability and the subsequent produced connate waters.
From Feb. 14 to Mar. 11, 1997, the interval began to produce larger volumes of water with increased chloride concentrations. The majority of this additional water was unaltered connate water with chlorides of 100,000-120,000 ppm.
Finally, by Aug. 20, 1997, the majority of this water became unaltered connate water.
Free shale water
Example 2 was taken from a study of wells with thin sand production.1 This example shows how "dirty sands" can be prematurely taken off production due to early water production or plugged perforations.
The reservoirs exhibited the following characteristics:
- High-pressure, high-production rates with rapid, extremely drastic decline rates in tubing pressure.
- Production of mud, salt, and shale or plugging of perforations.
- Water production with below normal salinity.
The wells were placed on production with a small or large pressure drawdown. The combination of thin sands and any pressure drawdown will cause a pressure imbalance that forces adjacent shale into the thin sands. In effect, this causes the free shale water to be released very much like water squeezed from a sponge, known otherwise as the snowball effect.
These free shale waters came into immediate contact with hydrocarbons for an extended period of time, becoming altered in composition during the process.
Mud filtrate
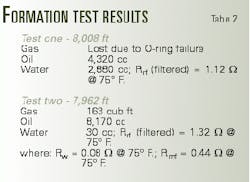
Example 3 describes two wireline formation tests, taken about 2 weeks after the sand had been drilled (Table 2). The most likely explanation for the recovery of low-salinity water in the flushed zone is that altered connate water and mud filtrate commingled, producing a mixture of waters with a lower salinity than unaltered mud filtrate.
In these examples, recovered low-salinity water is created when active and passive reactions altered the connate water that came into contact with the liquid hydrocarbons.
The formation water present in a gas-bearing sand will be highly altered as compared to unaltered formation waters, although the difference in salinity between this altered connate water and mud filtrate would not normally be as large as that seen in a liquid-hydrocarbon-filled sand.
It is for this reason that low-salinity water recovered from a formation test in a gas sand is not as apparent as from a condensate or oil-filled sand.
Possible connate water
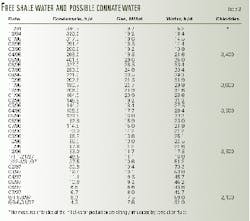
Example 4 shows evidence taken from a gas-condensate formation in the Gulf of Mexico (Table 3). The formation contains no water leg, and a water resistivity of 0.029 V-m (chlorides = 67,000 ppm) was determined in a nearby water sand under in situ conditions. Production is by gas-depletion drive.
From November 1994 to May 1995, personnel increased the choke size in stages to 128/64 in., remaining constant thereafter. Water production containing reduced water salinities provides evidence of formation damage caused by the snowball effect. Adjacent shale was forced into sands and free shale water was squeezed from the shale.
Next, from June 1995 to Jan. 21, 1997, the formation regained some stability with a constant choke size, partially supporting itself because additional shale cannot be easily forced into adjacent sands. Evidence of this phenomenon can be seen through a reduction in free shale water production.
An additional reason for the reduced free shale-water production is reduced net pay. As adjacent shale penetrates thin sands, production is eliminated.
As a result of a gas-depletion drive, the formation pressure then became smaller with the production of hydrocarbons and water during the next stage. From Jan. 22 to the end of February 1997, the formation reached a critical pressure reduction and then began a dramatic collapse as the shales above and below the sand laminations were forced into this pressure-depleted reservoir at increased rates.
Evidence of formation damage, as caused by the snowball effect, can be seen by the increase in produced altered free shale water. The increased free shale-water production provides evidence of the increased rate of penetration of adjacent shale into the pressure-depleted sand.
From March to Aug. 8, 1997, adjacent shale could not be as easily forced into sand as was the case from January to February 1997. Increased shale penetration from January to February 1997 increased the resistance to further penetration by shale into the sand. This is seen by the reduced rate of produced altered-formation water. Reduced net pay can again be attributed to reduced water production.
From Aug. 8, 1997, to Aug. 31, 1998, the formation again experienced sufficient pressure reduction, forcing sands at increased rates into the adjacent shales. Evidence of this increased rate of penetration can be seen by increasingly altered free shale-water production.
The complexity of the increased connate water thickness and produced hydrocarbon velocity vs. water production makes it difficult to predict if and when altered connate water would be produced from this reservoir.
Connate-water production will occur when the thickness of the water surrounding individual sand grains increases enough to become unstable at a specific hydrocarbon production rate. This particular hydrocarbon production rate will change through variables such as viscosity of produced hydrocarbon, grain size, permeability, and so on.
Example 1 illustrates that altered connate water production will not occur during initial production, while Examples 2 and 4 illustrate how altered free shale-water can be produced during initial production.
The change in chlorides from the initial production in April 1995 to that which was found in August 1997 can be used as evidence of a probable difference in altered connate and altered free shale-water salinity.
These observations show that free shale water forms the first altered water that was produced in Example 4 and contains a larger saline content than the connate water. This difference in salinity results from the connate water being physically closer to liquid hydrocarbons than free shale water.
Acknowledgments
The author wishes to thank Burlington Resources for contributions to this article.
References
- Fertl, W., and Leach, W.G., "Economics of Hydrocarbon Reserves in Overpressured Reservoirs Below 18,000 ft. in South Louisiana," SPE paper 18146, presented at the 63rd Annual Conference, Houston, Oct. 2-5, 1988.
- Paxton, S.T., Szabo, J.R., Calvert, C.S., and Ajdukiewicz, J.M., "Preservation of Primary Porosity in Deeply buried Sandstones: A New Play Concept from the Cretaceous Tuscaloosa Sandstone of Louisiana," American Assoc. of Petroleum Geology, Vol. 74, 1990, p. 737.
- Pottorf, R.D., and Sunna, L.L., "Interactions Between hydrocarbons, Water, and Sandstones: Implications for Reservoir Quality and Secondary Migration Timing," American Assoc. of Petroleum Geology, presented at the AAPG Annual Convention, Denver, June 12-15, 1994.
- Parker, J.R. (ed.), Gluyas, J.G., Robinson, A.G., Emery, D., and Oxtoby, N.H., "The Link between Petroleum Emplacement and Sandstone Cementation: Is it Caused or Casual?" Petroleum Geology of Northwest Europe: Proceedings of the 4th Conference, London, The Geological Society, 1993, pp. 1395-402.
- Gluyas, J.G., Leonard, A.J., and Oxtoby, N.H., "Diagenesis and Oil Emplacement: The race for Space-Ultra Trend," presented at the North Sea 13th International Sedimentological Congress, International Association of Sedimentologists, 1990, p 193.
- Lundegard, P.D., Kharaka, Y.K., and Rosenbauer, R.J., "Petroleum as a Potential Diagenetic Agent: Experimental Evidence," Proceedings of the 7th International Symposium on Water-Rock Interactions, 1992, pp. 329-35.
- Surdam, R.C., Jiao, Z.S, and McGowan, D.B., "Redox Reaction Involving Hydrocarbons and Mineral Oxidants: A Mechanism for Significant Porosity Enhancement in Sandstones," American Assoc. of Petroleum Geology, Bulletin 77, September 1993, pp. 1509-18.
- System 3-Agar's solution to desalting systems, http://www.agarcorp.com/AppNote3.htm.
- Equilibrium Moisture Content of Natural Gases, Institute of Gas Technology, November 1955.
The author
Lanny Dunham is a consulting petrophysicist with 35 years of experience. Previously, he was manager of petrophysical engineering at Transco Exploration Co. and has worked for Schlumberger. Dunham holds a BSEE from the University of Missouri.
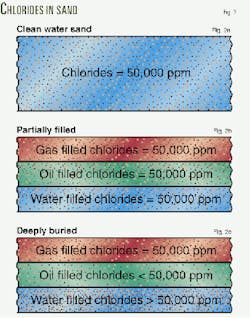
Passive and active reactions The effects of passive and active reaction can be seen in Fig. 2.First assume a clean water-filled sand that contains water with 50,000 ppm chlorides (Fig. 2a). Fig. 2b represents this sand after it was suddenly partially filled with dry gas and oil.
The salinity of the formation water in the dry gas and oil-filled portions of the sand immediatedly after the hydrocarbon entered the sand will remain a constant 50,000 ppm chlorides.
Fig. 2c illustrates the changes in formation-water chlorides after the sand has become more deeply buried. Because formation water salinity in water sands typically increase with depth, chlorides in the water leg would be larger than the initial 50,000 ppm chlorides.
The salinity of the water in the dry gas-filled portion of the sand remains unchanged at 50,000 ppm chlorides. The salinity of the waters adjacent to the oil will be smaller than 50,000 ppm chlorides.
Rules of Thumb A new perspective towards the evaluation of water and hydrocarbon analyses has generated several rules of thumb that may be useful for reservoir analysis:- The salinity of connate water in the hydrocarbon-filled portion of a sand is not identical to the salinity of the connate water below the hydrocarbon-water contact.
- Free shale water in close contact with hydrocarbons will contain a different salinity than free shale water not in immediate contact with hydrocarbons.
- Connate and free shale water in a gas cap will contain a different salinity than the connate and free shale water in an oil leg of the same sand.
- The connate water will have a different salinity than the free shale water in immediate contact with liquid hydrocarbons in the same sand.
- The waters in a hydrocarbon-filled carbonate formation will differ from the waters of a nearby water-filled carbonate formation.
- Because the salinity of waters in hydrocarbon-filled reservoirs is different from previously believed, all equations and theories that use this incorrect formation-water resistivity and salinity must be reexamined.
- Altered free shale water can be produced immediately. Altered connate water can be produced only after the pressure in the reservoir has been reduced enough to increase connate-water thickness.
- The amount of salts contained in liquid hydrocarbons is a function of the original salinity of the formation water before the hydrocarbons migrated into the reservoir and the length of time the hydrocarbons and formation water have been in contact.
