Oil, gas capital spending in US, Canada to jump sharply in 2000
Buoyed by higher crude oil prices, capital spending for oil and gas projects in the US and Canada will jump sharply this year from 1999 levels.
According to Oil & Gas Journal's annual capital expenditure survey, US outlays this year are expected to approach 1998's level, reversing their plunge of 1999. Spending in Canada will continue to rise, although by a healthier margin than it did last year.
Investments outside the US and Canada will dip, especially for upstream activities.
A year ago, spending in 1999 was expected to plummet due to extremely low oil prices and weak natural gas prices that had prevailed at the end of 1998 (OGJ, Apr. 5, 1999, p. 44). OGJ's survey shows that expenditures were indeed much lower in the US and areas outside North America. Although prices for crude oil and natural gas were on the rebound last year, companies remained cautious. Spending for Canadian projects in 1999 was mostly unchanged from the previous year.
It remains to be seen whether companies will continue to be as cautious this year with regard to spending plans. With many predicting that oil and gas demand worldwide will continue to rise this year, the consensus price forecasts suggest that oil prices will remain well above $20/bbl the rest of this year, while natural gas prices are expected to continue to be robust throughout the year as well.
Supply, demand, and prices
According to the International Energy Agency, worldwide demand for oil averaged 75.3 million b/d in 1999, up 1.7% from 74 million b/d in 1998. At the same time that demand was increasing last year, supply was decreasing-due in large part to OPEC's quota reductions-to an estimated 74 million b/d, down 2% from the prior year. Stocks of crude oil plummeted, down 2.7% in fourth quarter 1999. IEA projects that crude oil demand in 2000 will increase 2.4% from last year to an average 77 million b/d and that demand growth will continue to shift from Europe to Asia.
According to the US Energy Information Administration, demand for natural gas in the US has been steady, with total consumption up just 0.8% to 21.433 tcf in 1999 from 21.262 tcf in 1998. The most recent peak in gas demand was 22.1 tcf in 1972. OGJ estimates that US marketed natural gas production will rise by 1% to 19.867 tcf this year from 1999.
Capital spending plans often change throughout the year depending on cash flows, but the price of crude did not realize a truly sustained recovery until the end of 1999.
The average price of world export crude in 1998 was $11.92/bbl. Last year, the average jumped to $17.37/bbl. In February 2000, the price of world export crude averaged $26.94/bbl.
The average price for West Texas Intermediate crude fell to $14.15/bbl in 1998 from $19.73/bbl in 1997, rebounded to $17.71/bbl in 1999, and was $27/bbl this past February.
Natural gas prices have also been on the rise. Since averaging $2.03/MMbtu in 1998, the US natural gas spot price increased to $2.19/MMbtu in 1999 and $2.54/MMbtu in February 2000. The New York Mercantile Exchange futures price for natural gas averaged $2.31/ MMbtu in 1999, up 6.5% from 1998. The average price for February of this year was $2.60/MMbtu, up 32.3% from $1.76/MMbtu in February 1999.
US upstream spending
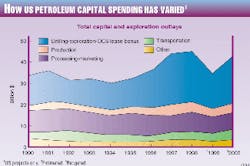
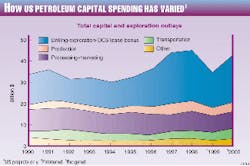
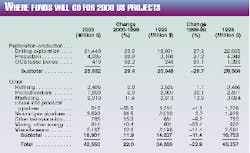
This year, companies plan to increase their US upstream spending by nearly 30% from last year to $26 billion. As expected, unsteady prices led E&P outlays to a 29.7% drop in 1999 vs. 1998.
Capital expenditures for exploration and drilling in the US are planned to reach $21.4 billion in 2000. A year ago, E&D spending was expected to drop by 23.1%. The actual decline, however, was 27.2% from 1998 levels, as companies remained skeptical about the scope of the oil price recovery.
Outer continental shelf (OCS) lease bonus payments collapsed to $249 million last year, the lowest since 1993, when they totaled $126 million. The US Minerals Management Service projects that OCS bonus payments will top 1999 levels by 68.3% at $419 million this year. MMS remains cautious with this year's estimate, however, which is significantly lower than the $1.32 billion in OCS lease bonus payments in 1998.
Capital spending on US production also fell in 1999, to $3.2 billion from $4.3 billion in 1998. Plans call for a sharp increase in spending for production and enhanced recovery projects this year, up 28.9% to $4.1 billion. Wellhead revenues vary along with production levels and prices of crude oil and natural gas. In 1999, US wellhead revenues moved up 16.4% on the year to $76.2 billion, and OGJ estimates that they will be up by a further 17.2% this year, to $92 billion.
Another indicator of upstream spending is the Baker Hughes Inc. count of active rotary rigs. While the US weekly rig count averaged only 625 for last year, there has been an upward trend since the tally bottomed last April. Late last month, the US rig count averaged 775. OGJ has forecast that rig activity will average 800 for this year. Well completions are also forecast to be up this year at 25,600. The number of US well completions reached a modern low in 1999 at an estimated 20,770 (OGJ, Jan. 31, 2000, p. 44).
Non-E&P spending
US non-E&P spending is projected to be higher than last year's level, up 11.9% to $16.6 billion. This follows a decline of 11.4% in 1999 to $14.8 billion. While there will be small fluctuations for spending on refining and petrochemical projects, larger shifts in spending will occur for pipelines, mining, and marketing.
Last year, there was a decline in outlays for petrochemicals, marketing, and mining and a small increase in spending for refining and gas pipelines. Crude and product pipeline outlays dropped slightly in 1999, and other transportation spending was lower by 9.2%.
Refinery investments in 1999 were up only 1.1% at $3.5 billion. This year, spending in this area will hold steady, expected to dip by only 0.8%.
Expenditures for refineries typically increase when a boost in demand for products is anticipated. In 1998, there was a 12.4% increase in refining capital spending. Demand for petroleum products in the US has been rising steadily throughout the past decade. In order to meet this demand growth, US refiners have been slowly adding capacity to existing refineries and restarting idle units. US operable refining capacity has increased from an average 15.594 million b/d in 1997 to 15.785 million in 1998 and to 16.3 million b/d in 1999, estimates the American Petroleum Institute. US refinery utilization has taken a turn, though. API calculates that capacity utilization dropped last year to a 4-year low of 92.6% after climbing to 95.4% in 1998 from 95.2% in 1997.
Capital spending on petrochemical plants will decrease by 6.9% to nearly $1.9 billion this year. This drop is much less steep than in 1999 when petrochemical spending fell by 30.1%.
In general, petrochemical investment operates in cycles and is driven by the state of the overall economy, as many consumer goods require the plastics that are manufactured with petrochemicals. In order to respond to increased demand, often there are large capital outlays as plants increase capacity, and the cycle is completed when demand drops and they are left with excess capacity and flat earnings.
Spending on natural gas pipelines is expected to surge this year. After posting a modest gain of 3.7% in 1999, expenditures will be up 84.5% to $3.69 billion for 2000. Conversely, investments for crude and products pipelines will plummet by 55.5% to $540 million from $1.2 billion in 1999.
Plans call for 3,222 miles of natural gas pipeline and 660 miles of crude and products pipeline to be laid in the US in 2000 (OGJ, Feb. 7, 2000, p. 36). This is up from total 1999 construction, with 1,734 miles of natural gas pipeline and 1,540 miles of crude and products pipeline laid that year (OGJ, Feb. 8, 1999, p. 36).
Capital spending on transport equipment other than pipelines is expected to climb 15.3% in 2000 to $785 million vs. a drop of 9.2% to $681 million in 1999.
Spending on marketing facilities will increase 11.4% to $2.9 billion this year. In recent years, budgets have been cut in this area due to lower cash flows. In 1999, capital expenditures for marketing decreased 13.6%, following a 6.9% drop in 1998.
Capital spending by petroleum companies on non-petroleum activities in the US is estimated to increase by 15.5% in 2000 to $3.3 billion, after falling 19.3% in 1999 to $2.8 billion. This type of spending is also greatly influenced by cash flows.
Capital spending in Canada
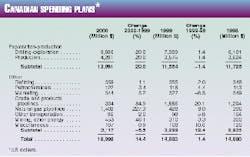
An increase in capital expenditures in Canada is also expected this year, although it will be smaller than the boost in US spending. Plans call for total spending in Canada to move up 14.4% to $17 billion from $14.9 billion in 1999.
Investments in Canada are heavily weighted on the upstream side of the industry. Last year, total Canadian spending was nearly unchanged from 1998, up only 1.4%. While upstream spending was down slightly in 1999, non-E&P spending increased by 12.4%.
Canadian E&P spending has increased significantly since the early 1990s, when it averaged only $5.5 billion/year. Since then, Canadian gas production has increased to meet rising demand in US markets.
Drilling and exploration expenditures are expected to jump this year to $9.6 billion, up 20% from $8 billion in 1999. Production expenditures will increase to $4.3 billion, putting total Canadian E&P spending at $13.9 billion. The closest it ever has come to this record high was when it hit $11.9 billion in 1997.
The Canadian weekly rig count has fallen in the past 2 years, averaging 261 in 1998 and 246 last year, down from an average of 375 in 1997. For February 2000, the average weekly tally of active rigs in Canada recovered to 544. Well completions in Canada are projected to rebound this year as well. OGJ estimates a 12.3% increase in Canadian well completions, up to 13,771 this year vs. 12,076 in 1999 (OGJ, Jan. 31, 2000, p. 64).
Total Canadian non-E&P spending will be off slightly from last year, with dramatic changes in the types of pipeline expenditures offsetting each other. In 1999, non-E&P spending increased by 12.4%, buoyed by a 29.1% rise in crude and products pipeline outlays. This year, expenditures for crude and products pipelines in Canada are expected to sink by 84.9% to $234 million. Spending in this category peaked in 1999 at $1.6 billion; its recent low was a mere $7 million in 1992.
Spending for natural gas pipelines, on the other hand, will more than triple from last year. Up 227.3% to $1.4 billion, spending on natural gas pipelines will dominate non-E&P spending in Canada in 2000. The increase to $428 million in 1999 natural gas pipeline spending was a modest 8% gain from 1998.
A total of 1,420 miles of new pipeline construction is planned for Canada in 2000. Natural gas pipelines account for 1,047 miles of this total (OGJ, Feb. 7, 2000, p. 36). In 1999, construction was planned for a total of 1,835 miles of new pipe (OGJ, Feb. 8, 1999, p. 36). Expenditures for transportation activities other than pipelines are expected to dip 2% to $96 million this year.
Canadian refining spending is projected to inch up 1.1% to $359 million. Last year, refining expenditures were up 2% at $355 million. Petrochemical spending will show a small gain this year as well, moving up 3.4% to $122 million after increasing 4.4% to $118 million in 1999.
Marketing outlays are planned to move back up after their 1999 decline of 6.3%, rising by 5.2% this year to $344 million.
Spending in Canada for mining and other energy projects, including oilsands development, is expected to jump by 46.1% to $453 million vs. $310 million last year. Oil and gas industry capital spending for non-petroleum activities in Canada is planned to be lower by 0.9% this year, to $107 million.
Spending outside US and Canada
Although US and Canadian companies are planning to spend more money in their two countries this year, they are planning to spend less for projects outside the US and Canada.
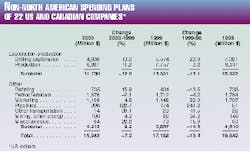
The OGJ survey collected data from 22 companies based in the US and Canada that are planning capital and exploration expenditures for projects outside the US and Canada this year. These companies plan to spend $15.9 billion on such projects, a 7.2% decrease from the $17.2 billion they spent in 1999. In 1998, these same companies spent $19.8 billion on projects outside the US and Canada.
In this geographical category, E&P budgets have been decreased, but non-E&P spending is expected to increase in 2000.
Breaking down the companies' plans, expenditures for drilling and exploration will diminish by 13.2% to $4.8 billion this year. In 1999, these investments were 23.9% lower than in the previous year. Production outlays are expected to be 11.2% lower, settling at $6.9 billion. In total, US and Canadian companies will spend 12% less on upstream expenditures outside the US and Canada compared with last year.
Non-E&P spending outside the US and Canada is expected to be up 9.2% at $4.2 billion. In 1999, outlays in this area were $3.9 billion, down 14.5% from $4.5 billion in 1998.
The strongest gain in non-E&P spending will be for pipelines. Plans call for these 22 companies to spend $398 million in 2000 for pipeline construction, 128.7% more than last year.
Spending will fall slightly for petrochemical projects, down 2.1% to $1.7 billion. Refining spending, however, will increase 15.9% from 1999 to $735 million. Marketing expenditures will also move up this year to $1.2 billion, a 4.5% jump.
All other non-E&P outlays by these companies will be up 7.7% to $208 million from $192 million in 1999.
