Use of near infrared (NIR) technology with a software system for calibrating models can reduce the start-up time for stream-analyzer systems from 1 year to less than a month.
In an application in a Canadian refinery, NIR with software calibration offers a 98% utilization factor and better performance than NIR using conventional calibration. (Utilization factor is the percentage of time the analyzer performs well enough to operate under closed-loop process control.)
The utilization rate is higher than for a conventional analyzer because almost no service is required to maintain an NIR system with software calibration. The refinery uses Freetune, a software program developed by PetroMetrix to create robust unit models, in conjunction with the NIR application to reduce model-development time.
NIR advantages, drawbacks
Refinery operators increasingly depend on real-time systems such as advanced process control (APC) to maximize profitability. A successful APC project is only as good, however, as the quality and availability of the real-time process data. Although gas chromatographs are the conventional method for supplying frequent process data to the APC software, NIR technology is gaining acceptance.
NIR process analysis techniques were initially used in laboratories in the late 1970s. At the beginning of the previous decade, plant operators adopted NIR for process applications.
Use of fiberoptic cables for NIR technology reduces most of the up-front costs normally associated with property analyzers. It also eliminates the purchase of several property analyzers, shelters, and sample-conditioning systems.
NIR requires calibration models to predict properties of the product. It therefore requires not only hardware, as with traditional analyzers, but also software.
An important difference between NIR and traditional analyzers is that NIR's measurement principle uses light absorbency, which is universal, making it suitable for most refinery streams. It can employ a universal spectrometer platform, embedding different calibration models for various properties of each particular process stream.
NIR's main advantages compared with traditional measurement techniques are:
- Capacity to predict multiple properties simultaneously; for example, research octane number (RON), motor octane number (MON), distillation points, benzene, and total olefins content, with one probe.
- Capacity to monitor multiple streams with one analyzer.
- Fast response time, less than 0.5-5 min.
- High precision and stability over long periods of time.
- Low cost of ownership.
The main drawback of NIR is related to the software, not the hardware. The software requires resources (time and money) to build the models and maintain the model robustness.
Building models
For applications with high economic incentives, such as crude-distillation and product blending units, a successful implementation of NIR can take up to 12 months.
The bottleneck is not the supplier's delivery time or the limits on laboratory resources, it is the effort to make the models robust. Robustness requires that the model cover all possible variations of the product composition, which constantly changes over time. Therefore, although very powerful, current NIR systems are not "plug and play" devices.
The traditional approach to building models is mapping all possible compositional variations of an analyzed product based on hundreds of collected product samples. A chemometric specialist selects the proper samples that represent the process variations and uses regression techniques (such as partial least squares or principle component regression) or nonregression techniques (such as topology), to build the model.
A model built upon this traditional method requires constant maintenance. When a new, unknown feed is run in the unit, the model must be revised. This approach is far from "plug and play."
Recognizing these awkward procedures, Petro Metrix developed a software application, called Freetune, which enables "plug and play" within a week after system start-up. Freetune links the analyzer to the plant information system, using the available plant data for automatic model tuning.
The advantages of this software approach are that:
- It reaches guaranteed performance, comparable to or better than that of ASTM (American Society for Testing & Materials) standards, within a few days of start-up.
- It requires no special human resources, such as chemometrics engineers, to build the models and maintain the analyzer.
- Utilization factor of the analyzer is better than with the standard calibration approach.
The new software program consists of two sequential blocks.
First, partial least squares regression builds a localized sensitivity model based on a small number of samples. This model is sensitive to short term (hours) process variations.
The model can be quickly built and validated because it is localized. This procedure takes up to 1 week, and can be performed before or after start-up.
In the second block, a proprietary software program processes the model and the specified plant data to quantify properties. This model predicts long-term product variability.
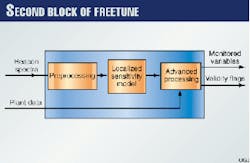
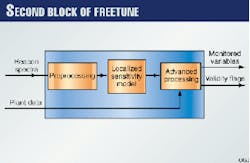
Fig. 1 shows the Freetune block diagram of the second block. The inputs are the spectra measured by PetroMetrix's Beacon System and the plant data. The outputs are the monitored variables and the validity flags. Each variable has a corresponding validity flag.
There are some similarities between the new approach and the traditional inferred property approach. Both approaches use plant data to predict product properties.
The traditional inferred property approach relies only on the process data, which changes slowly because of delays in unit reactions. The new approach, however, relies on both the true sample composition as measured every 30 sec by the Beacon System and additional process data.
Thus, in principle, the new approach is superior to the traditional one. To test this logic, PetroMetrix applied both methods to analyze a diesel stream from a crude-distillation unit.
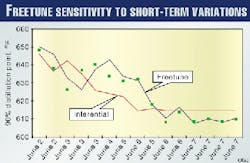
Fig. 2 shows measurement of the 90% distillation point. The new approach has a better dynamic behavior than the inferential approach. Thus, the operator has better control over the crude unit.
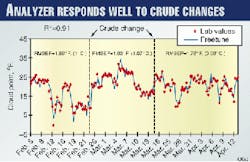
If the analyzer is properly calibrated, changing the crude does not influence the analyzer's behavior. Fig. 3 shows the analyzer's output for diesel cloud point while the unit switched to new crudes twice. The local sensitivity model used in this application contained 22 samples.
The variation in the root mean square error of prediction (RMSEP) among the three different crude periods is negligible. It is better than the ASTM D2500 specifications for reproducibility limit.
Site description, requirements
PetroMetrix installed Freetune in a project associated with new construction of a crude-distillation unit in an Ontario refinery in 1999. Fig. 4 shows the plant-flow diagram. The plant has two crude-distillation units.
The refinery combines the naphtha streams from both towers with a C5/C6 stream. A prefractionation tower receives this combined stream. The prefractionator overhead feeds the isomerization unit, and the bottoms are charged to the reformer unit.
The APC has several jobs:
- Minimize the quantity of C7+ in the pre-fractionator overhead.
- Reduce the benzene concentration below 1.5% in the prefractionator bottoms.
- Control the Reid vapor pressure (Rvp), RON, and MON of the stabilizer bottom.
Table 1 indicates the required properties and streams analyzed by the APC. Such application traditionally requires two gas chromatographs, an Rvp analyzer, and RON and MON engines. The minimum alternative requirement is two gas chromatographs and one Rvp analyzer.
By using NIR and the Freetune software, the refinery saved $200,000 in capital investment and $30,000 in annual operating costs.
The system configuration at the Canadian refinery consists of a single analyzer, installed in a distributed control system (DCS) equipment room. Fiberoptic cables connect the analyzer to three sample cells installed in the plant next to the relevant process streams.
The sample system does not require a conditioned shelter despite the cold environment of the installation site. The field units indicated in Fig. 4 are in fiberglass enclosures to protect the valves from the frost. The distance between the field units and the analyzers is 400-600 m.
The field units are connected to the process streams by short, fast sampling loops. The samples are not conditioned. The analyzer communicates with the DCS via Modbus protocol, a standard digital communication between the programmable logic controller and DCS. Measurement cycle time is approximately 1 min.
Start-up, calibration, and testing
The system was started on Aug. 30, 1999. It took about 5 days to connect the fiberoptic cables and the DCS, perform the installation test procedures, and check the hardware performance of the complete system (including the fiberoptic cables).
An additional 5 days were required to program the DCS, install the Freetune software, and calibrate the analyzer. The refinery swung the unit with various feeds to make sure that the calibration could handle a variety of upsets.
Validating the analyzer performance and completing the site acceptance test required 7 more days.
Table 2 presents the test results in comparison to the guaranteed results. The reproducibility numbers show the comparison between the reproducibility of Freetune and the ASTM method.
The Freetune program ensured the robustness of the calibration. With it, no recalibration or calibration fine-tuning was required. The system automatically adjusted the calibration models to various conditions.
The automatic adjustment relies on periodical lab measurement performed on all three streams. To maintain this level of reliability in this particular application, the Freetune program required routine feedback results from the plant lab on randomly grabbed samples.
Benefits
There are two important benefits to using NIR and Freetune to analyze stream properties:
- Low maintenance requirements require lower expenses.
- The analyzer's improved performance results in a higher utilization factor.
Maintenance costs include costs incurred by using the new program, purchasing analyzer spare, consumable parts, and applying periodic maintenance. Without NIR, the combined maintenance cost of flash and freeze property on-line analyzers is about $20,000/year.
With NIR, the maintenance cost to analyze the same properties is $2,000/year and the cost for an additional kerosine property, such as 90% distillation point, is zero.
In the Canadian refinery, the use of NIR and Freetune achieved a utilization factor of 98% during the 6 months of NIR analyzer operation. With the traditional analyzer, 98% utilization can only be achieved under rare and expensive conditions:
- Superb analyzer maintenance.
- An extensive preventive maintenance program with an inventory of spare parts on hand.
- Exceptionally good instrumentation.
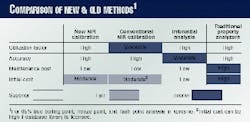
Table 3 shows the performance of four options: conventional NIR calibration, new NIR calibration, inferential analysis, and traditional property analysis. The new calibration NIR performs better than the traditional property analyzers with inferential analysis. Although NIR is more expensive, this cost is reduced when more than one stream property is analyzed.
There is a tradeoff between the different analysis methods. For low budgets and compromises on accuracy, inferential analysis may be appropriate. For performance and a savings on instrumentation and maintenance, however, NIR calibration is the best choice.
The Authors
Ilan Sela is the chief executive officer and founder of PetroMetrix Ltd., Migdal Ha'Emek, Israel. He specializes in applied spectroscopy and fiber optics. Sela holds a PhD in applied physics from Technion, the Israel Institute of Technology.
Naftaly Fontjin has been an engineering manager at PetroMetrix Ltd. since 1996. He has 10 years' experience in the field of computer hardware and software development. Fontjin holds a degree in electrical engineering from Technion, the Israel Institute of Technology.
Irena Zilberman has been a software engineer specializing in chemometrics at PetroMetrix Ltd. since 1993. Zilberman holds an MSc in applied mathematics from Kazan State University, Russia.
