Processed-crude quality in US continues downward trend
A review of historical 10-year data on crude oil gravity and sulfur content shows that generally poorer-quality crudes are being processed in the US.
The Energy Information Administration (EIA) reports monthly and yearly composite values of gravity and sulfur content of crudes processed within five Petroleum Administration for Defense Districts (PADDs). For a diagram of PADDs, see OGJ, Oct. 5, 1998, p. 43.
This article updates a previous article on gravity and sulfur contents of crudes (OGJ, Oct. 5, 1998, p. 43).
Table 1 and Figs. 1 and 2 show composite values of gravity and sulfur contents of crudes processed in refineries in the past 10 years, broken out by PADD.
Four factors determine crude quality processed by refineries:
- Crude types available, whether from domestic or foreign sources.
- Refinery configurations, whether they can handle crude-quality variations.
- Crude-quality price structure.
- Marketable product slate, whether it can give reasonably good refinery operating margins.
PADD 1
Refineries operating in PADD 1, the US East Coast, increased the use of foreign crudes from a low of a little more than 80% in the early 1980s to 98% in 1998.
East Coast refineries are light, sweet-crude processors that mainly produce light transportation products for local consumption. Refinery owners in this region have been reluctant to invest in bottom-of-the-barrel processing units to handle heavy crudes.
In this region of the country, light, sweet crudes cost only marginally more than poor-quality crudes.
Between 1989 and 1998, the average 10-year gravity trend was +0.22° API/year; the sulfur content trend was -0.025 wt %/year. In the most recent 5-year period, however, the crude got lighter by +0.46° API/year, and the sulfur content decreased at a rate of -0.009 wt %/year.
Increasing quantities of imported crude from African countries, mainly Angola and Nigeria, and North Sea countries, mainly Norway, contributed to increasing quantities of high-gravity, low-sulfur crudes.
Crude types processed by Sunoco Inc.'s two East Coast refineries (Table 2) give an indication of the trend towards these crudes. Sunoco's two refineries process about 30% of total 1998 PADD 1 crude runs.
The top six imported crude oils in this region in 1998 were Nigeria (290,000 b/cd), Angola (246,000 b/cd), Venezuela (205,000 b/cd), Saudi Arabia (164,000 b/cd), Norway (152,000 b/cd), and Canada (113,000 b/cd).
Here are a few important statistics for PADD 1 refineries in 1998:
- As a result of higher refinery operating rates, crude runs in 1998 increased by 86,000 b/cd to 1.57 million b/cd between 1997 and 1998.
- Refineries operated at 93.8% of capacity.
- Processed crudes had a composite gravity of 33.42° API and a sulfur content of 0.93 wt %.
- Refineries imported about 1.53 million b/cd of foreign-source crudes, 79,000 b/cd more than that in 1997.
PADD 2
PADD 2 consists of a group of states just west of PADD 1, including Illinois, Kentucky, and Oklahoma. Refineries operating in PADD 2 increased their use of foreign crudes from the low 20% range in the mid-1980s to 49% in 1998.
Crude qualities were slightly heavier for the 10-year period between 1989 and 1998 as compared to the 10-year period between 1988 and 1997; it decreased by 0.15° API/year vs. 0.14° API/year.
Sulfur content during these 10 years increased by about 0.024 wt %/year. Between the 5-year period of 1994 and 1998, the gravity decreased by an average of 0.33° API/year, and the sulfur content of the crude increased by 0.039 wt %/year.
The top six imported crude oils into this region were Canada (899,000 b/cd), Saudi Arabia (181,000 b/cd), Venezuela (130,000 b/cd), Colombia (99,000 b/cd), Nigeria (94,000 b/cd), and Angola (84,000 b/cd).
Following are Important statistics for PADD 2 refineries in 1998:
- Crude runs in 1998 decreased by 179,000 b/cd to 3.37 million b/cd between 1997 and 1998.
- Refineries operated at 97.2% of capacity.
- Crudes processed had a composite gravity of 32.94° API and a sulfur content of 1.23 wt %.
- Refineries imported about 1.66 million b/cd of crude, 28,000 b/cd more than that in 1997.
- Alaskan crude receipts were 4,000 b/cd in 1998, a 52% decrease from 1997 receipts.
PADD 3
PADD 3 consists of New Mexico, Texas, Arkansas, Louisiana, Mississippi, and Alabama.
Refineries operating in PADD 3 increased their use of foreign crude imports from the upper 20% range in the mid-1980s to nearly 68% in 1998. Crude quality continued to drop off quickly in the 10-year period between 1989 and 1998, by -0.23° API/year; this is the same rate of decline that was observed in the period between 1988 and 1997.
Sulfur content increased compared to the previous survey. Sulfur content increased by about 0.028 wt %/year between 1989 and 1998. In the previous 10-year roundup, the rate of sulfur content increased by 0.021 wt %/year.
Between 1994 and 1998, crude weight decreased by 0.21° API/year, and sulfur content increased by 0.049 wt %/year.
Although crude production within PADD 3 states increased from 3.12 million b/cd in 1995 to 3.29 million b/cd in 1998, PADD 3 must still import foreign crudes to meet refining demand.
PADD 3 refineries involved in any of five joint ventures between the US and other countries are modifying their equipment to process crudes from Mexico and Venezuela.
These crudes are medium to heavy and have a medium-sulfur content. Thus, the trends towards heavier slates and higher sulfur contents should continue (Figs. 1 and 2).
The top six imported crude oils in 1998 into this region were Mexico (1.21 million b/cd), Saudi Arabia (1.04 million b/cd), Venezuela (1.02 million b/cd), Nigeria (304,000 b/cd), Iraq (248,000 b/cd), and Kuwait (235,000 b/cd).
Important statistics for PADD 3 refineries in 1998 include:
- Crude runs in 1998 increased by 112,000 b/cd to 6.96 million b/cd between 1997 and 1998.
- Refineries operated at 96.7% of capacity.
- Crudes processed had a composite gravity of 31.49° API and a sulfur content of 1.45 wt %.
- Refineries imported about 4.88 million b/cd of crude, 272,000 b/cd more than that in 1997.
- PADD 5 received no Alaskan crude during 1998.
PADD 4
Refineries operating in PADD 4 are well isolated from foreign crude oils other than Canadian crude oils. They process local crudes from Montana, Wyoming, Utah, and Colorado.
Rocky Mountain refineries processed 30% more Canadian crude in 1998 than in the mid-1980s. The crude quality declined by 0.31° API/year between 1989 and 1998, and by 0.42° API/year between 1994 and 1998.
Sulfur quality has also decreased slightly. Sulfur content increased by 0.062 wt %/year between 1989 and 1998 and by 0.034 wt %/year between 1994 and 1998.
The production of light, low-sulfur crude in this region has dropped by about 15,000 b/cd in the past 5 years in deference to imported Canadian crudes. With Canadian crudes, the trend towards heavier crudes with more sulfur content will continue.
Important statistics for PADD 4 refineries in 1998 include:
- Crude runs in 1998 increased by 11,000 b/cd to 480,000 b/cd between 1997 and 1998.
- Refineries operated at 92.7% of capacity.
- Crudes processed had a composite gravity of 33.18° API and a sulfur content of 1.35 wt %.
- Refineries imported about 134,000 b/cd of crude, all from Canada-10,000 b/cd more than that from 1997.
PADD 5
Refineries operating in PADD 5 increased the amount of imported crudes from 14% in 1980 to more than 19% in 1998. PADD 5 consists of Alaska, Washington, Oregon, Nevada, California, Arizona, and Hawaii.
Crudes processed in this region had an average gravity of 25.48° API between the 10-year period of 1989 and 1998. Sulfur content increased moderately at a rate of 0.012 wt %/year during this time.
During the 5-year period between 1994 and 1998, the gravity increased an average of 0.05° API/year and sulfur content increased by about 0.018 wt %/year.
Oil production rates decreased by about 106,000 b/cd/year, mostly a reflection of a reduction in Alaskan North Slope (ANS) oil fields, which accounts for 94,000 b/cd. Hardly any Alaskan crudes were shipped to other PADDs in 1998. About 43,000 b/cd of ANS were exported to China, Japan, South Korea, and Taiwan, however.
Two Hawaiian refineries process crudes from the Pacific Rim and the Middle East regions, plus some ANS. The refineries in the northwest Pacific process ANS and Canadian crudes.
California refineries mainly process crudes from California and ANS. California crudes are of rather poor quality: 25-26° API and a sulfur content of 1.05-1.10 wt %.
The top six sources of imported crudes into PADD 5 in 1998 were Canada (107,000 b/cd), Iraq (58,000 b/cd), Ecuador (54,000 b/cd), Indonesia (46,000 b/cd), Kuwait (37,000 b/cd), and Australia (30,000 b/cd).
Important statistics for PADD 5 refineries in 1998 include:
- Crude runs in 1998 increased by 7,000 b/cd to 2.51 million b/cd between 1997 and 1998.
- Refineries operated at 92.7% of capacity.
- Crudes processed had a composite gravity of 25.22° API and a sulfur content of 1.22 wt %.
- Refineries imported about 499,000 b/cd of crude, 90,000 b/cd more than during 1997.
- The regional refineries received 1.2 million b/cd crude from Alaska in 1998, 3.1% less than in 1997.
Total US
The quality of crudes processed in the US is moderately declining (Figs. 1 and 2). Gravity has dropped about 0.11° API/year between 1989 and 1998, and sulfur content has increased about 0.020 wt %/year.
During the 5-year period between 1994 and 1998, the rate of declining gravity remained the same, about -0.11° API/year, and the sulfur content increased by 0.046 wt %/year. Imported crudes replacing domestic crudes have about the same gravity but a higher sulfur content.
In 1994, imported crudes averaged about 7.06 million b/cd. In 1998, imported crudes averaged about 8.71 million b/cd. As domestic crude production falls, US refineries must rely on imported crudes.
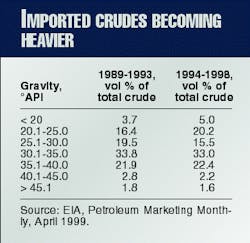
Table 3 lists the average volume of imported crudes by the US between 1994 and 1998, categorized by weight.
In the next 10 years, imported crudes will tend to be heavier. Reasons include increased worldwide demand for crude, particularly in Pacific Rim countries, price spreads in crude grades by gravity, political stability of crude-producing regions, and decreasing production of high gravity, low sulfur crudes.
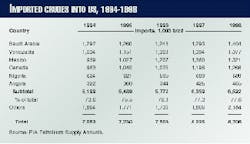
The top six sources of imported crude to the US in 1998 were Saudi Arabia (1.40 million b/cd), Venezuela (1.38 million b/cd), Mexico (1.32 million b/cd), Canada (1.27 million b/cd), Nigeria (689,000 b/cd), and Angola (465,000 b/cd).
These six countries represent 78% of imported crudes to the US in 1998. A total of 35 countries provided crude to the US in 1998. Table 4 shows a 5-year history of the volumes of major imported crudes to the US.
The Author
Edward J. Swain is an independent consultant in Houston. He is retired from Bechtel Corp., where he was a process planning engineer. Before joining Bechtel, he worked for UOP and Velsicol Chemical Corp.
Swain holds a BS in chemical engineering and an MS in business and engineering administration, both from the Illinois Institute of Technology in Chicago.


