Over space, spectra, time, satellite data can improve exploration, other planning
Imaging satellites are used every day to design seismic surveys, find least-cost pipeline routes, to site, build, and maintain facilities, to do corridor maintenance, and to help us work smarter in every phase of exploration. We don't have to process the information any more or have special training to analyze it: Just looking at the images tells us what we have to know.
Here is a primer on understanding how satellite remote sensing data are organized and how they can benefit industry.
Remote sensing characteristics
Three key factors determine the information content of remote sensing data: spatial, spectral, and temporal.
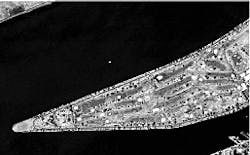
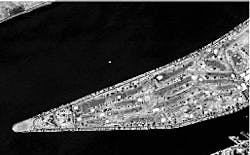
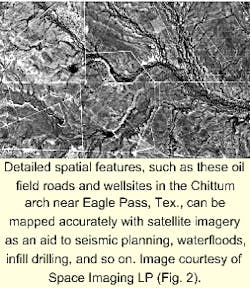
Spatial is from the root word space and deals with distance or fine detail. These details may include large, regional features (faults, folds, anticlines, etc.) to items as small as cars, lines on a tennis court, and even some people (Figs. 1 and 2).
Spatial detail is best seen in black and white.
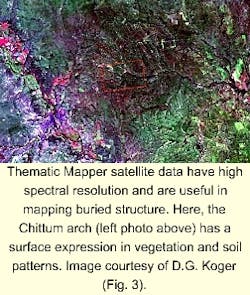
Spectral means color. Satellites record many more colors beyond those visible. Electromagnetic radiation (EMR) is the scientific term for color. Going from shorter to longer wavelengths, EMR includes visible light (i.e. blue-green-red), infrared, thermal, radar, and so on.
These spectra are gathered in precise, definite segments, then processed with a computer before being evaluated visually. Sensors that collect multiple spectra are called multispectral sensors, or MSS.
Temporal refers to how often an area is revisited. Satellites record the earth in every season, climate, and moon phase and have for decades. Change detection-subtracting one time from another time-shows what is there now, what used to be there, and what comes and goes.
Spatial shows location, physical distance, and detail: the space dimension (Figs. 1 and 2). Spectral tells material composition: activity in the energy dimension (Fig. 3). Temporal records when and how often: the time dimension (Fig. 3 vs. Fig. 4).
Spatial at work
Sensors that collect much spatial detail (1 in. equals 400 ft, or 1:4,800 scale) will pinpoint well locations and help avoid holes in seismic shoots for items such as gates, fencelines, and recent man-made structures. They can also help lay out least-cost pipeline routes by showing obstructions to possible routes such as brush, trees, crops, roads, wetlands, newly populated areas, etc.
It is possible to know terrain and elevation with extreme geometric accuracy, with five times the detail of 1:24,000 scale topographic maps, anywhere on earth without traveling there.
With a mid-level personal computer a user can "fly" through 3D models of an area (Fig. 5) interactively, controlling flight speed, altitude, and look angle and direction.
Different, older satellites collect data for use at scales of 1:50,000, 1:100,000 and more. This information is better suited to E&P tasks such as mapping basins, rifts, folds, faults, domes, and other oil-trapping structures, mineral assemblages, and surface anomalies.
Satellite data analysis can delineate prospect leads of good quality (close a subsurface nosing, help decide which way to drill out from a show, and help map fracture trend orientation).1 2
Spectral at work
Where sunlight interacts with water, soils, or vegetation, most of the EMR is invisible. But MSS satellites "see" literally hundreds of such energy-matter interactions. Lots of critical information lies beyond human's narrow window of visible light.3 4
Data of the spectral kind help delineate profitable opportunities-oily structures, tonal anomalies, hydrothermal alterations-and obstacles to profit-leaks in pipelines, urbanization, vegetation encroaching on corridors, and environmental trouble.
Temporal at work
Sun angle affects how an area appears. A low sun angle is best for photogeologic analysis of low-relief areas with undeformed sediments. High sun angle is better for mountainous areas.
Weather conditions best complement the application of satellite data. A multitemporal approach is called for to characterize the sensitive near-coast transition zones at high and low tides (i.e., time). It is possible to examine oil slick sources and to differentiate the noneconomic kind, which come and go, from naturally occurring oil slicks.
In support of geochemical surveys it is necessary to:
- Derive soil conditions before laying out the sampling grid;
- Map soil moisture variations (wet vs. dry); and
- Include this knowledge in calculating data contours.
Near term refinements
Satellite hardware is lighter now and cheaper to lift into orbit, where it is more nimble, stable, and sensitive than 1970s-80s payloads.
More data of every kind are available. Three companies are each committed to launching "birds" that outperform today's spatial and spectral sensors. Better digital elevation models (DEMs) will be possible and will deliver greater topographic detail, which translates into better and more current logistical details such as gradients, creeks, roads, and hills and valleys.
Hyperspectral, as the term is being used in the industry, is a sensor that collects 32 to 400 bands of light for each patch of earth sampled. Hyperspectral does for light energy what a scanning electron microscope does for detail.
Because every mineral reflects light in a specific way, each can be identified accurately and inexpensively with hyperspectral sensors. Hydrocarbons, minerals, and biota are detected and mapped via the distinctive way their molecules reflect and absorb light.
Conclusion
The oil and gas business is highly challenging. Prices fluctuate, new tools and techniques call out to be evaluated, and the environment must be protected.
One constant is that decisions must be made with too little money and not enough information. Remote sensing data are totally unique and extraordinarly cost-effective. They take the measure of earth in ways no other tool can. Packed with several kinds of information, remote sensing is a tool well worth of the modest effort to understand it.
References
- Koger, D.G., "A close look at photogeology, remote sensing, and image analysis," OGJ, Dec. 5, 1988, pp. 54-57.
- Koger, D.G., "Landsat 6 images to provide more remote sensing muscle," OGJ, Feb. 1, 1993, pp. 51-55.
- Koger, D.G., and Dodge, R.L., "Geosat starts up R&D on exploration sensor," OGJ, Oct. 5, 1998, p. 113.
- Koger, D.G., and Dodge, R.L., "NASA, Geosat to conduct sensor research probe," OGJ, Apr. 5, 1999, p. 82.
The Author
Dave Koger is proprietor of Koger Remote Sensing, Fort Worth, and past chairman of the Geosat Committee. E-mail: dkoger@aol. com


