Method measures commingled production, pipeline components
An analytic method discriminates and quantifies the constituent cuts in commingled reservoir production and pipeline streams.
It uses Fourier transform infrared spectrometry (FT-IR) on crude oils and works even if the constituents exhibit minute compositional differences.
The quantitative analysis uses the IR spectrum band between 3,150 cm-1 and 2,750 cm-1. This region provides characteristic oil "fingerprints" whose shape is directly related to composition.
The method can be used as a rapid and inexpensive monitoring tool for applications such as production allocation in commingled reservoir streams and pipelines, multilayer hydrocarbon reservoir management, reservoir compartmentalization, and reservoir-fluid discrimination.
A case study illustrates the accuracy of this method for identifying the volumetric cuts in a three-oil mixture.
Commingled streams
Efficient management of hydrocarbon reservoirs producing from commingled zones demands that one know the contribution of individual production streams to total production.
Often, hydrocarbon fluids recovered from different depths of the same reservoir or from adjacent formations have similar geological origins and hence compositions. Consequently, the conventional compositional characterization methods are usually inadequate for discriminating fluids with similar physical and chemical properties.
Knowing the compositional differences between fluids aids in detecting reservoir compartmentalization and can contribute to determining compositional changes. This information is important for planning the development and operations of oil fields.
Furthermore, one can minimize offshore installation costs if crude oils from different reservoirs or fields are commingled in the same flowline. In these cases, production allocation can be difficult if one only uses some of the physical properties of each stream.
Operators have employed a number of analytical methods for identifying different oils in a mixture, such as:
- Gas chromatography (GC).
- Gas chromatography-mass spectroscopy (GC-MS).
- Liquid chromatography (LC).
- Gel permeation chromatography (GPC).
GC analysis is a common analytical technique for identifying oils. It can provide information about the productivity of separate zones in layered reservoirs.1-3 But when applied on separate fractions of the oils, GC analysis can be time-consuming and relatively complex.
Fluorescence and ultraviolet spectrophotometers can identify oils by monitoring the characteristic chromophore groups. Reyas discussed rapid fingerprinting of oils with a total scanning fluorescence spectroscopy.4 Also, Gray described a method for monitoring polyaromatic hydrocarbons in oils using this same analytical technique.5
Varotsis and Pasadakis presented a GPC method coupled with ultraviolet diode array (UV-DAD) and IR detectors.6 This method discriminated among three oils produced from a layered reservoir. Although the oils exhibited minute compositional differences, the absolute error in the volumetric cut determination was less than 5%.
Compared to the other methods mentioned, the main advantage of FT-IR method is that the analysis requires less time and is considerably simpler. In addition, the absolute error in the quantitative determination of the constituents was found to be less than 2%.
FT-IR analyses use differences in the IR oil spectra in the region of about 3,000 cm-1. This region is often excluded from the FT-IR analysis of undiluted oil samples because the signal appears saturated due to the strong absorbency of the carbon-hydrogen (C-H) bonds.
Nevertheless, this region contains significant information of the overall oil sample composition. In this region, the structures that mainly absorb are as follows:
- CH3 at 2,975 to 2,950 cm-1 and 2,885 to 2,860 cm-1.
- (CH2)n at 2,935 to 2,915 cm-1 and 2,865 to 2,840 cm-1, depending on the type of molecule.
Nitrogen compounds present in oils also absorb in this region.
Example case
For verifying the method, the experiments used oil samples including condensates and volatile and black oils.
One test involved three 30° API gravity oil streams (referred to as A, B, and C) from a Mediterranean black-oil reservoir. The three oils, produced from separate zones of a layered reservoir, are believed to be isolated from each other by impermeable clays. The three oils exhibited minute differences in their chemical compositions.
The laboratory tests included a series of mixtures of these oils in different amounts.
The analysis involved preparing a carbon tetrachloride (CCl4) solution (1:50 by volume), which is transparent between 4,000 cm-1 and 1,700 cm-1 when a 0.1 mm path length is used. Dichloromethane and dichloroethane, considered less hazardous than CCl4, were also successfully used as solvents.
The tests indicated that the accuracy of the method was independent of the selected solvent used.
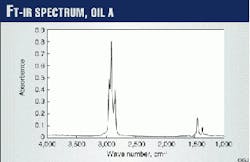
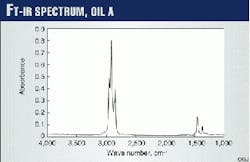
A Perkin-Elmer Spectrum 1000 FT spectrophotometer, with potassium bromide (KBr) cells of 0.1 mm fixed-path length, recorded the IR spectra between 4,000 cm-1 and 400 cm-1, at steps of 4 cm-1. Fig. 1 presents the FT-IR spectrum of Oil A in a CCl4 solution.
To eliminate the effect of the solvent, the test required the determination of the background solvent spectrum before each analysis and then subtracting it from the sample spectrum.
The three crude oil samples initially had a relatively high water content that obscured the analytical procedure. Water, even when present at low concentrations, reacts with the KBr cells and also influences the spectrum's pattern because it absorbs in the 4,000-3,500 cm-1 and 1,900-1,300 cm-1 regions.
The test eliminated the water from the oil samples with an intensive sample homogenization process in an ultrasound bath that was followed by dilution (1:5 by volume) in CCl4. This procedure clearly separated the oil phase from the water. The oil-phase sample was then further diluted in CCl4 until it achieved the desired concentration (1:50 by volume).
To ensure complete absence of water, the test included the addition of sodium hydride (NaH) to the final solution.
The procedure then filtered the sample through a 20-m membrane filter before the FT-IR analysis.Test results
The test involved collecting oil samples in the IR spectrum band between 3,300 cm-1 and 2,450 cm-1, after baseline subtraction, for further treatment. The main peaks in this range appear near the wave numbers 2,960 cm-1, 2,870 cm-1, 2,925 cm-1, and 2,850 cm-1. The analysis subsequently normalized these peaks for equal area under the spectrum curve.
Finally, to measure the volumetric cuts of the oils in the mixtures, the analysis used the region between 2,834 cm-1 and 2,990 cm-1.
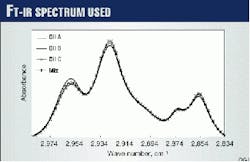
Fig. 2 shows the IR spectra for Oils A, B, and C and for one of their prepared mixtures. The procedure involved iterative calculations for determining the volume fractions of the constituents.
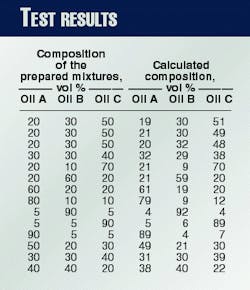
The iteration used an equation system that minimized the difference between the acquired signal of the actual mixture and of the reconstituted signal at each wave number within the selected region. Table 1 presents typical results.
The maximum absolute error for the volume fractions of the constituents in the mixtures was equal to or less than 2%. This value constitutes a significant improvement compared to the absolute error of plus or minus 5% obtained with a GPC analytical method on the same fluids.
The test indicated that the signals were highly reproducible.
Of note is that the differences in the intensities among the signals due to compositional variations were in the order of ten times magnitude larger than any differences that occurred due to the repeatability of the analyses.
References
- Metcalfe, R.S., Vogel, J.L., and Morris, R.W., "Compositional Gradients in the Anschutz Ranch East Field," Paper No. SPE14412, 1988.
- Smalley, P.C., and Hale, N.A., "Early Identification of Reservoir Compartmentalization by Combining a Range of Conventional and Novel Data Types," SPE Formation Evaluation, September 1996, p. 163.
- Smalley, P.C., and England, W.A., "Reservoir Compartmentalization Assessed With Fluid Compositional data," SPE Reservoir Engineering, August 1994, p. 157.
- Reyas, M.V, "Crude Oil Fingerprinting by the Total Scanning Fluoresence Technique," Paper No. SPE26943, 1993.
- Gray, N.R., Requejo, A.C., Kerr, J.M., and McDonald, T.J., "Rapid Characterization of PAH's in Oils and Soils by Total Scanning Fluorescence," Paper No. SPE25990, 1993.
- Varotsis, N., and Pasadakis, N., "An Analytical Method for Rapid Monitoring of the Degree of Hydrogenation of Recycled Lubricating Motor Oils," Journal of Liquid Chromatography & Related Technologies, Vol. 21, No. 5, 1998, p. 657.
The Authors
Nikos Pasadakis is a research fellow at the PVT and core-analysis laboratory of the Technical University of Crete in Greece. His research interests include chemical analysis of petroleum fluids, chemometric application in petroleum, and experimental phase-behavior studies.
Pasadakis holds an MS in petroleum chemical engineering and a PhD in physical chemistry from the Technical University of Lvow.
Eleni Chamiklaki is a post-graduate student at the PVT and core-analysis laboratory of the Technical University of Crete, Greece. Her research interests include chemical analysis of petroleum fluids. She is a graduate of the chemistry department of the University of Crete.
Nikos Varotsis is professor and director of the PVT and core-analysis laboratory of the Technical University of Crete, Greece. He previously was the head of the fluid analysis research and development group for Schlumberger in Melun, France. Varotsis holds an MS in chemical engineering from the Technical University in Athens and a masters in engineering and PhD in petroleum engineering from Heriot-Watt University, UK.


