Gravity and sulfur-based crude valuations more accurate than believed
In the Gulf Coast market, short of sophisticated product-based valuation methods (such as linear-program simulations), gravity and sulfur-based estimates of crude oil valuation are as accurate as product-based valuation.
Moreover, gravity and sulfur-based estimates are more consistent and uniform in their accuracy regarding individual crudes than product-based estimates.
The use of estimates of crude oil relative value for planning and commercial purposes is pervasive in the oil industry. Businesses usually use one of two common methods for estimating crude oil relative values:
- Product-based valuation, which considers the differentials in the value of the products that can be refined from various crude oils.
- Gravity and sulfur-based valuation, which considers the differentials based on gravity and sulfur differences.
It is widely believed that product-based crude relative values more accurately estimate market relative values. Some believe that gravity and sulfur differentials are an atavistic holdover from the industry's simpler past and produce less-accurate estimates of market relative value.
When tested in the Gulf Coast crude market over the 6-year period of 1993-1998, however, both product-based relative values and gravity and sulfur-based values produced fairly accurate estimates of market relative value.
Crude oil relative values
The participants in the end or consumption market for crude oil buy and sell crude oils for and to refineries.
For a given refinery, the "relative value in use" between Crudes A and B is the difference in value between the marketable products that can be made from Crude A and the products that can be made from Crude B. Because the relative use values are determined at the margin of operation, the difference in operating expenses for two crudes are de minimis.
Linear-program (LP) models of individual refineries are routinely used to determine the relative use values among crudes. Given a set of product prices, the LP model simulates the operation of the refinery that produces a yield of products that maximizes the total value of products refinable from a given crude.
The relative use value will be realized by the refinery, however, only if Crudes A and B have the same price. Any difference in the market value or " relative value in exchange" between Crudes A and B will add to or subtract from the actual amount realized by the refinery.
The price at which buyers and sellers agree to exchange crude and dollars determine the relative exchange values among crudes. For the buyer, the relative use value represents the maximum he or she should be willing to pay for one crude over the other. For the seller, the buyer's relative use value represents the maximum he or she reasonably can expect to receive for one crude over the other. Any transaction is actually likely to occur at a lesser relative value.
If the relative exchange values of crude oils were identical to a given refinery's relative values in use, the refinery would be indifferent regarding which crude it purchased. Buyers for refineries do not display indifference regarding crudes, however.
Thus, it is unlikely that relative exchange values are identical to any given refinery's relative values in use. Moreover, if the relative use values equaled relative exchange values, the buyer of crude would be relinquishing to the seller of the crude all of the relative value created by refining the crude-an unlikely event.
Nonetheless, it is virtually an article of faith in the industry that differences in market or exchange values among crudes are accurately estimated by differences in product values.
As a practical matter, product valuations directly based on LP simulations are rarely used in commercial transactions. Instead, a set of boiling-point defined distillation cuts represent the product yields to which corresponding product prices are applied to value the crudes.
For example, the volume distilled between 450° F. and 650° F. may be taken as the volume of diesel fuel obtainable from a given crude. The market price for diesel fuel is then applied to the 450-650° F. volume.
The product prices may be adjusted to account for differences between the actual qualities of the cuts and the quality specifications for the products. For example, when the sulfur specification for the diesel fuel product differs from the sulfur content of the crude's 450-650° F. cut, an adjustment to the diesel fuel price may be made to account for the difference.
In many commercial transactions, however, relative market values are estimated using, not product valuation, but rather differences in the API gravity or the sulfur content of the crudes.
Despite their common use, gravity and sulfur are generally viewed as inexact, atavistic holdovers from the industry's simpler past-before the advent of high-conversion refineries, sophisticated market trading operations, and LP models. Gravity and sulfur differentials are said either to be "good enough" when high accuracy is not called for or "accurate enough" when used to estimate market relative values among otherwise similar crudes.
Product valuation
The US Gulf Coast crude oil market consists of domestic crude grades from Texas and Louisiana and foreign grades from South and Central America, the Mideast, the North Sea, and West Africa.
Table 1 shows average annual market relative values of 19 of these crude oils for the period 1993-1998. The spread of the market relative values for each year is summarized at the bottom of the table by calculating the standard deviations.
Table 2 contains average annual product-based values for the crudes in Table 1 calculated using a simple product valuation method that applies Gulf Coast product prices to each crude's yields for nine distillation cuts (C3, iC4, nC4, C5-175° F., 175-350° F., 350-450° F., 450-650° F., 650-1,000° F., and 1,000° F.+). When the market relative values in Table 1 are regressed against these product-based relative values, there is a correlation between the market relative values and product-based relative values (Table 3).
The regression procedure calculates two numbers of interest here: the X-coefficient and the R2 statistic.
The X-coefficient is the factor by which each of the individual product-based relative values must be multiplied in order to remove any systematic (and therefore quantifiable and correctable) differences between the product-based relative values and the market relative values.
For example, the X-coefficient for 1995 in Table 3, 1.35, indicates that the product-based relative values for 1995 are on average smaller than the market relative values. When each of the individual product-based relative values is increased by multiplying by 1.35, the resulting adjusted product-based relative values are no longer biased (i.e., understated) estimates of the market relative values.
This adjustment does not make the product-based relative values accurate estimates of the market relative values, just unbiased estimates.
The R2 statistic indicates the extent to which the adjusted product-based relative values are accurate estimates of the market relative values. For example, the R2 statistic for 1995 in Table 3, 0.79, indicates that on average the adjusted product-based relative values replicate 79% of the market relative values. On average over the 6 years, the product-based relative values replicate about 83% of the market relative values.
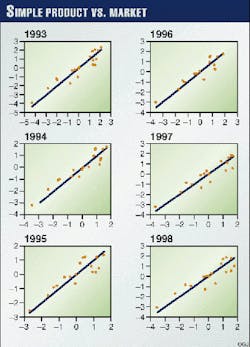
The accuracy with which the market relative values of individual crudes are replicated is not uniform. This can be seen quite clearly in the graphs in Fig. 1 which plot the adjusted product-based relative values against the market relative values.
The vertical distance between the individual points on the graph and the diagonal line represents the amount by which the adjusted product-based relative values differ from the market relative value. Points tightly clustered around the diagonal represent accurate replication.
In each of the 6 years, product-based relative values for the higher-valued crudes (the points to the right in the graphs) are much more widely dispersed from the diagonal line than are the lower-valued crudes (the points to the left in the graphs).
Product valuation implicitly assumes that the more accurately the individual products from a crude are valued, the more accurate will be the overall crude valuation. The product-based values in Table 2 take account of differences in the quantities, but not the qualities, of the cut yields produced from the individual crudes.
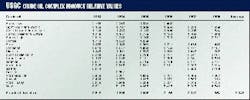
Table 4 contains product-based relative values for the crudes in Table 1 using a more complex product valuation that takes account of, not only the quantities, but also the qualities of four of the cuts from the individual crudes (octane and Rvp of the C5-175° F. and 175-350° F. cuts; sulfur content of the 450-650° F. cut; viscosity of the 1,000° F.+ cut).
The regression results for these complex product-based relative values are shown in Table 5.
The X-coefficients show that these product-based relative values are also biased, but in this case in the opposite direction. The X-coefficient for 1995, 0.67, indicates that the product-based relative values are on average larger than the market relative values.
When the product-based relative values are adjusted to remove the bias, however, the R2 statistics show that overall accuracy is significantly improved. For 1995, for example, the adjusted complex product-based relative values replicate 90% of the market relative values compared to 79% for the simpler product-based values.
Over the 6 years, these product-based relative values replicate approximately 95% of the market relative values compared to the 83% for the simple product-based relative values-an 8 to 15 percentage point improvement in each of the years.
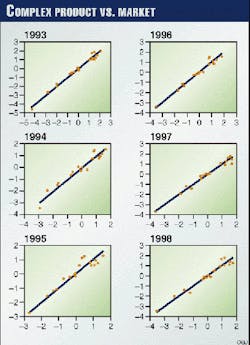
For the most part, the improvement in overall accuracy results from improved accuracy for the higher-value crudes. This can be clearly seen by comparing the graphs in Fig. 2 with those in Fig. 1.
In each of the 6 years, while still more dispersed from the diagonal line than the lower-valued crudes, the higher-value crudes in Fig. 2 are significantly more tightly clustered about the diagonal line.
API and sulfur valuation
In commercial transactions, differences in API gravity and sulfur content among crude oils are often used to estimate market relative values for the crudes-more often than are differences in product-based values.
The leftmost data columns of Table 6 contain API gravity and sulfur values for the crudes in Table 1. Table 7 shows the results of regressing the market relative values against these API and sulfur values.
In this case, there are two X-coefficients corresponding to the two variables, API gravity and sulfur. Because the gravity and sulfur coefficients are regression calculated, they produce unbiased estimates of the market relative values when the gravity and sulfur values of the individual crudes are multiplied by the coefficients and the products summed (Table 6).
The R2 statistics in Table 7 for these gravity and sulfur-based relative values indicate that they are as accurate in their replication of market relative values as the adjusted complex product-based relative values.
For individual years (Tables 5 and 7), the gravity and sulfur-based relative values are slightly more accurate in some cases and less in others, but over the 6 years, the gravity and sulfur-based values replicate approximately 95% of the market relative values-the same as the complex product-based values.
While similar in overall accuracy, the gravity and sulfur-based relative values differ in two ways from the product-based relative values:
First, the gravity and sulfur-based relative values are more consistent over time in their overall accuracy. Over the 6 years, their accuracy varies by only 3 percentage points compared to 8 percentage points for the accuracy of complex product-based relative values.
The greater variability in accuracy of the complex product-based relative values is the result of a correlation between accuracy and market relative value spread. The R2 statistics for the complex product-based relative values are strongly correlated with the standard deviations of the market relative values.
When the spread of market relative values increases so does the accuracy with which the product-based relative values replicate the market relative values. When the spread decreases, so does the accuracy of the relative value replication.
In contrast, the accuracy of the gravity and sulfur-based relative values is independent of the spread of market relative values. There is no correlation between their R2 statistics and the standard deviations of the market relative values.
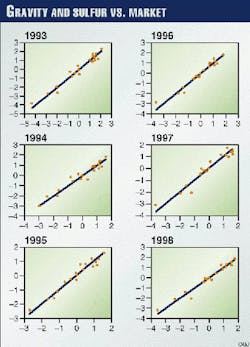
Second, the gravity and sulfur-based values are also more uniform in the accuracy of their replication of individual market relative values. Comparing the graphs in Fig. 3 with the graphs in Fig. 2 shows this uniformity.
In Fig. 3, the dispersion of the gravity and sulfur-based relative values about the diagonal lines is fairly uniform throughout the range from lowest to highest value crudes. In Fig. 2, the higher-value crudes are significantly more dispersed (i.e., less accurate) than the lower-value crudes.
Acknowledgments
Stephen S. Hill, a partner in the Washington office of the law firm of Sidley & Austin, provided valuable advice in the preparation of the manuscript.
Bibliography
Crude oil and petroleum product price assessments published by Petroleum Intelligence Weekly, Oil Price Information Service, and Platt's Oilgram Price Report HPI Consultants, assay database.
The Author
Karl R. Pavlovic is president of DOXA Inc., a private consulting firm providing operations and economic analyses of energy and network-based industries. He has conducted many studies of petroleum and petroleum product markets in connection with crude oil pipeline quality bank litigation. Pavlovic holds a BA in philosophy from Yale College, New Haven, Conn., and an MA and PhD in philosophy from Purdue University, West Lafayette, Ind.


