Integrated Approach To Property Evaluation Improves Decision-making For Both Parties
Sophisticated evaluation of a farm-in exploration deal should reflect two characteristics not always evident in routine transactions.
One characteristic is analysis by each party from the perspectives of both sides of the deal under evaluation. The other is the integrated use of what are called deterministic and probabilistic evaluation techniques.
Deterministic evaluation produces a single estimate of value from a given set of input variables. Probabilistic evaluation yields a range of values, each represented as a function of the statistical chance for its occurrence.
The common mistake is for a party to a prospective farm-in arrangement to evaluate from its perspective alone using only, or predominantly, one method for evaluation and risk analysis.
Both perspectives
A typical farm-in arrangement involves the holder of all or part of an exploration or production permit (the farmor) and the party to which part of the farmor's interest will be assigned (the farminee).
To earn the assigned interest, the farminee often provides funding on promoted terms, paying a percentage of exploration costs greater than the percentage of the working interest earned.
Some of the evaluation needs of the parties are straightforward.
The farmor, for example, needs to evaluate the risked value of the project to the farmor without a farm-in deal. This calculated value, adjusted to reflect the probability of success, is called expected monetary value (EMV). The farmor needs to ask whether the EMV is positive.
If the EMV of the farmor's existing holding in the permit is negative, the farmor needs to know what dilution in exploration costs and exposure are required to make the EMV positive (and what technical work is needed to either reduce the risk or condemn the prospect).
The farmor further needs to determine the minimum promote paid by a farminee to improve the risked value of the project to the farmor compared to the val ue of its existing holding in the permit.
Also im portant to the farmor is the maximum promote that can be realistically undertaken and still enable a farminee to achieve an economic return on a risked basis. And the farmor must evaluate the downside risks and financial exposure associated with the range of farm-in terms being considered and for the prospect itself excluding a farm-in deal.
On the other side of the transaction, the farminee needs to evaluate the EMV of that portion of the project that the farminee will ultimately be assigned without any promote in the terms. Is that EMV positive? If it is not, then a promoted deal will not make economic sense.
The farminee must estimate the minimum promote that can be realistically achieved and enable the farmor to improve its EMV by completing a farm-in deal. It also must consider the maximum promote that will yield a positive EMV for the farminee.
And, like the farmor, the farminee must assess the downside risks and financial exposure associated with the range of farm-in terms being considered.
A range of other factors usually complicates this view of the evaluation and analysis needed to precede negotiations for agreeing acceptable farm-in terms.
In spite of these complicating factors, the farmor and farminee must attempt an assessment of the risked value of the permit from each other's position in order to establish a negotiating position and identify whether a deal is achievable.
The value at which a deal can economically be made falls in the area where the farmor and farminee's respective ranges of acceptable values overlap.
Integrating techniques
A risked economic evaluation of a hypothetical prospect with three pay zones illustrates how probabilistic simulation modeling and deterministic valuation and risk analysis techniques combine to provide useful insight to economic evaluation of a farm-in opportunity.
The example assumes that Company X holds a 100% working interest in an exploration permit in a productive basin. There is a one-well drilling commitment on the permit, which should be fulfilled by the end of 2000.
Company X has shot a seismic survey and identified one well-defined prospect. There is potential for additional prospects. The concession has three reservoir objectives that have produced oil elsewhere in the basin. In the prospect defined, these reservoirs are estimated to have the following most likely recoverable-reserves potential:
- Primary objective-Target Zone A: 50 million bbl recoverable.
- Secondary objective-Target Zone B: 15 million bbl recoverable.
- Tertiary objective-Target Zone C: 5 million bbl recoverable.
All three targets can be tested by one exploration well, which is programmed to cost $15 million spread across 1999 and 2000 to drill and test Zone A. It will cost $500,000 for each of two additional well tests to evaluate Zones B and C in 2000. The total outstanding exploration costs are $16 million ($15.4 million discounted to the start of 2000). This cost is taken as the dry-hole cost (risk capital), as all three zones are expected to require testing to prove or condemn them.
Company X's economic analysis has assumed successful development scenarios for each zone as follows:
- Reservoir Target A will be brought on stream in 2000 at 8,000 bo/d and reach peak production of 20,000 bo/d in 2002, declining to 1,000 bo/d in 2013. It will require development capital of $115 million ($30 million in 2000; $60 million in 2001; $10 million in 2002; $5 million in 2003; $1 million/year in subsequent years). Operating costs are estimated to have a fixed component of $2 million/year (2000-08) and $1 million/year (2009-13) and a variable component of $5/bbl of production.
- Reservoir Target B will be brought on stream in 2002 at 2,000 bo/d and reach peak production of 7,000 bo/d in 2004, declining to 500 bo/d in 2013. It will require development capital of $20 million (50% in 2001, 25% each in 2002 and 2003). Operating costs are estimated to have a fixed component of $500,000/year (2002-2008) and $300,000/year (2009-2013) and a variable component of $3/bbl of production.
- Reservoir Target C will be brought on stream in 2003 at 1,000 bo/d and reach peak production of 3,000 bo/d in 2005, declining to 300 bo/d in 2013. It will require development capital of $10 million (50% in 2002 and 50% in 2003). Operating costs are estimated to have a fixed component of $300,000/year (2003-08) and $100,000/year (2009-13) and a variable component of $3/bbl of production.
Company X has developed a deterministic cash-flow spreadsheet model for the prospect incorporating gross revenue, capital and operating costs, and 40% income tax. Company X's view of most likely oil price is $16/bbl in 2000, escalating at 3%/year. Its view of most likely inflation of costs is also 3%/year.
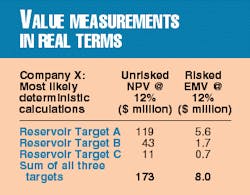
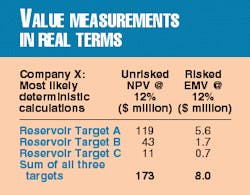
Company X calculates deterministically total values for each zone on an unrisked basis as a most likely real NPV discounted at 12% to start year 2000 and on a risked basis a most likely real EMV discounted at 12% to start year 2000. Table 1 shows the most likely values for each zone and the total prospect.
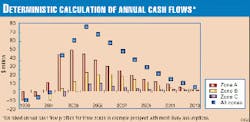
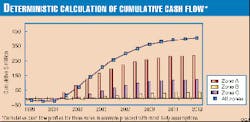
Figs. 1 and 2 show the annual and cumulative post-tax calculated cash flow profiles for each target and the total prospect based upon the above deterministic scenario.
Potential farminee
Company X has defined the risks associated with each reservoir and calculates a positive EMV. It is therefore keen to drill the well. However, Company X has funding problems and may have to delay work on this license.
A potential farminee has approached Company X expressing interest to farm in to the license and negotiate terms for a 50% working interest.
In this example it is assumed that both company X and the farminee value the prospect using the same reserves and economic assumptions. In a real situation this is unlikely, but it is assumed here to emphasize the impact of different perceptions of risk on prospect valuation.
Indeed, in some cases where both parties value a prospect using exactly the same values for reserves, economic variables, and risk, it can be more difficult to reach agreement on farm-in terms, as there can be less overlap in perceived values and therefore less room for a deal.
Risk analysis
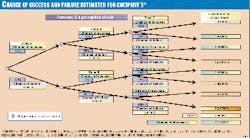
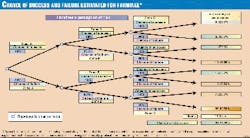
The perceptions of risk associated with the target zones of the example prospect for Company X and the farminee are shown in Figs. 3 and 4. These diagrams represent the chance components of a decision tree.1 As they do not in themselves incorporate decisions they are better termed "chance trees" for this application.
The chance trees illustrate the chance of success associated with each target and the eight combinations of outcomes that may occur for the exploration well. The chance of success for each target reservoir in this example is assumed to integrate:
- Geological risk (presence of mature source rock, migration, reservoir, and trap).
- Technological risk (ability to drill and develop reservoir at economic costs).
- Political and fiscal risk (ability to produce and sell hydrocarbons and receive profitable and timely post-tax returns on investments).
A clear definition of "success" is required to make these risk assessments meaningful. In this example, success is taken to mean that a target reservoir flowed economically producible quantities of hydrocarbons to the surface during a well test. For a real prospect, a minimum flow rate should be established as the economic threshold for that particular area so that success can be clearly quantified.
The chances of success and failure of the individual targets are multiplied along the branches of the chance tree to calculate the probabilities associated with each of the eight possible well outcomes.
It is assumed that Company X and the farminee have the same perception of risk for Target Zone A (15% chance of success) and Zone C (10% chance of success). However, Company X assigns a 5% chance of success to Zone B, whereas the farminee assigns a 15% chance of success to that zone.
Such a difference could easily arise if the farminee had more information on that reservoir from elsewhere in the basin or perhaps envisages applying new technology to improve recovery from a difficult reservoir. Whatever the reasons, this difference in risk assessment of just one zone has a profound effect on the probabilities of the possible well outcomes.
Company X believes that its chance of making a discovery in any one zone is 27% (1 minus the probability of a dry hole in all three zones shown on the lower branch of the chance tree), whereas the farminee believes that its chance of making a discovery in any one zone is 35%.
From both Figs. 3 and 4, it is clear that making a discovery in more than one target zone has a very low probability. Company X calculates a probability of 2.5% of finding oil in two zones (maximum of 1.4% for Zones A and C). The farminee calculates a probability of 4.6% of finding oil in two zones (maximum of 2.0% for Zones A and B). For both parties, the chance of finding oil in all three zones is extremely small (Company X 0.075%, farminee 0.225%). The wide variation in probabilities associated with the different possible well outcomes means that some outcomes make a much more significant contribution to EMV than others.
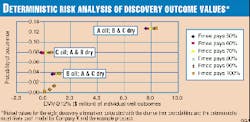
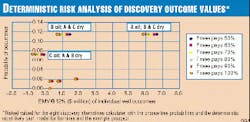
Figs. 5 and 6 plot the EMV's (calculated deterministically on the basis of most-likely assumptions) associated with the discovery outcomes for Company X and the farminee, respectively. Values associated with different farm-in terms are also illustrated, varying from the farminee paying 100% to 50% of the exploration well costs to earn a 50% working interest in the license.
For both parties, the EMV associated with the outcome of a discovery in just Zone A dominates the total EMV. This is to be expected, as Zone A is significantly larger in terms of unrisked reserves and value than the other two zones and is perceived to have similar or better chances of success. It is important for this particular prospect that neither party loses sight of this point in its evaluations and concentrates on estimating as accurately as possible the costs and reserves for Zone A.
As the farminee pays a larger promote with respect to the exploration costs, the risked value of discoveries in single zones increases for Company X (Fig. 5) and decreases for the farminee (Fig. 6). The risked values associated with discoveries in more than one zone are barely changed by different farm-in terms, as the dry hole cost component is much reduced in the calculation of their risked values.
A discovery in Zone C on its own yields a negative EMV for the farminee and for Company X unless promoted farm-in terms apply. Zone C is the least economically robust stand-alone target. However, Zone C does contribute to the small positive EMVs of some well outcomes where more than one zone yields discoveries, so it should not be written off on the basis of a single risked-outcome value that is negative.
Fig. 6 shows that, for the farminee, Zone B contributes a much more significant value to the total EMV than for Company X. The EMV for a discovery in just Zone B is about 20% of the EMV for a single discovery in Zone A. Also, the EMV for a discovery in both Zone A and Zone B is about 20% of the EMV for a single discovery in Zone A.
The evaluation of Zone B from a geological and engineering point of view is therefore much more important to the farminee than to Company X in the valuation of the prospect. It is not unusual for the parties in real prospects to focus on different zones completely in their valuations because of the relative importance of those zones to their respective EMVs.
Detailed analysis
This detailed analysis of risk associated with multizone targets helps an analyst to focus on which actual outcomes determine the key values and financial exposures.
An analyst for Company X could focus almost exclusively on Zone A and be confident that the derived analysis is representative of the prospect's value based upon Company X's assumptions and perceptions of risk. On the other hand, an analyst for the farminee would need to focus on both Zones A and B to be confident of identifying realistic values to that party.
It would, however, be prudent for both parties to perform sensitivity analysis on all zones to identify values that their current most-likely assumptions may be failing to identify.
Financial exposure
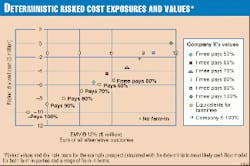
It is instructive to analyze the dry-hole risked costs versus the total most likely EMV for the prospect.
Fig. 7 shows the deterministic calculations of these parameters for the most likely input assumptions for Company X and the farminee for a range of farm-in terms. The risked dry hole cost versus the prospect EMV for Company X with no farm-in terms (100% prospect case) is plotted for comparison.
As the farminee pays a greater share of the exploration well costs, the risked dry-hole cost decreases for Company X, reaching zero when the farminee pays 100% of the well costs and the EMV for Company X increases. Fig. 7 suggests that the farminee would have to pay more than 75% of the exploration well costs to earn a 50% working interest for the EMV of Company X to be greater than in the case where Company X retains 100% working interest.
Fig. 7 also illustrates that all the farm-in terms analyzed reduce the dry-hole cost exposure of Company X relative to the no-farm-in case. Reducing cost exposure may be a more important driver to Company X than maximizing EMV in negotiating farm-in terms.
In cases where the farminee pays more than about 90% of the exploration well costs to earn a 50% working interest, the EMV for the farminee becomes negative. A deal on such terms would be unattractive for the farminee.
Farm-in terms can be evaluated in further detail through risk analysis and evaluation that establish the probabilities associated with certain risked values and quantify the downside risks of both parties.
Analysis of the example property to this point, however, shows how the integration of deterministic and probabilistic techniques can fine-tune the evaluation for parties on both sides of the prospective transaction.
Reference
- Magee, J.F., "Decision trees for decision making," Harvard Business Review, Vol. 42, No. 4, 1964, pp. 126-38.
The Author
David Wood is an exploration and production consultant specializing in the integration of technical and economic evaluation with management and acquisitions strategy. He is a director of E&P management courses with the College of Petroleum Studies (Oxford, UK).
After receiving a PhD in geochemistry from Imperial College in London, Wood conducted deep-sea drilling research and in the early 1980s worked with Phillips Petroleum Co. and Amoco Corp. on E&P projects in Africa and Europe. From 1987 to 1993, he managed several independent Canadian E&P companies (Lundin Group) in senior corporate and technical roles, working in South America, the Middle East, and Far East from bases in Colombia and Dubai. From 1993 to 1998, he acquired and managed a portfolio of onshore UK and North Sea companies and assets as managing director for Candecca Resources Ltd.
