Prestack Depth Migration Helps Seismic Imaging In Salt-Prone Pre-Caspian Basin
This article was adapted from a presentation given at the European Association of Geoscientists & Engineers 60th Conference and Technical Exhibition, Leipzig, June 8-12, 1998.
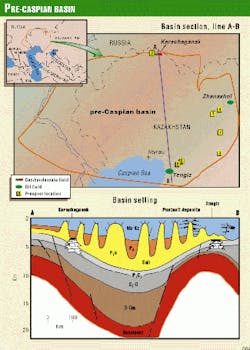
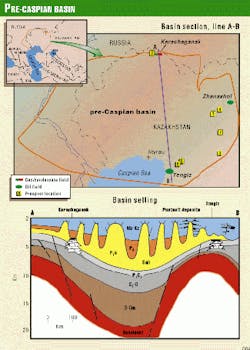
The pre-Caspian basin is a major salt-dome basin and the deepest such basin in the world. The basin's potential for oil and gas production rivals that of the North Sea basin. Being the southeastern depressed part of the Russian platform, the pre-Caspian basin is located north of the Caspian Sea (Fig. 1). The basin's southern edge underlies the Caspian Sea.
The sedimentary cover of the basin comprises presalt, salt, and postsalt. The major hydrocarbon resources are associated with the presalt. The giant oil-gas field Tengiz and oil-gas-condensate field Karachaganak are located in the basin's presalt carbonates.
Although not that big reserves-wise, the abundant postsalt fields of the basin-altogether more than 200 oil fields-represent promising exploration targets due to high oil quality and shallow depth.
However, the pre-Caspian basin lags behind several other salt-dome basins in the degree to which it has been studied by 3D seismic and prestack depth migration (PDM), an important technique for proper seismic imaging of salt bodies and surrounding sediments.
In a basin where salt sediment thickness of 4-5 km is common and domes can be very complex, those methods are crucial because of steeply dipping reflectors, strong and complicated refractors (primarily, salt roof), and developed faulting.
For the reflection seismic, these factors cause effects that make the corresponding fragments of resulting images either noninterpretable or misinterpretable. The effects include essential lateral velocity variation and diffraction. In each case, the basis for the problem-solving is precise definition of velocities along with proper migration. As the recent experience in the pre-Caspian basin indicates, the most-efficient resolution of the problem is provided by PDM.
This article will outline results of PDM application aimed at pre- and postsalt prospects study. Prior to reviewing field data, it is helpful to consider model results that throw light on features of seismic when studying a salt-dome structure.
Modeling and features
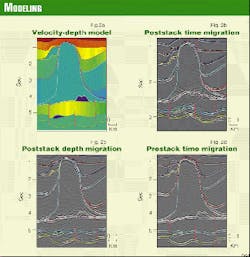
The model was built based on one of the salt domes of the pre-Caspian basin's eastern margin (see location 1, Fig. 1). The model was complicated by typical tectonic faults and high-velocity carbonate bodies in the presalt sediments as well as by the high-velocity salt lens adjacent the dome (Fig. 2, at left). Note the carbonate bodies allocated in the less-favorable conditions under steeply dipping salt flanks.
Modeling of 2D records with 6-km maximum offset and 60-fold coverage yielded a synthetic data set that was processed with prestack and poststack time and depth migration. Poststack migrations used model velocities while the prestack one-the depth-velocity model-was built with prestack technique.
The poststack depth migrations-both time and depth-confirmed the considerable impact of dipping horizons and lateral velocity variation on imaging. The problems lead to interruptions of horizons and to structural errors and false events resulting from wrong focusing of the reflections during normal moveout (NMO) removal, dip moveout (DMO), stack, and migration of presalt and postsalt data. Poor imaging of presalt carbonates doesn't allow their identification.
The salt lens causes misplacement of underlying postsalt horizons that are also "shadowed" by the lens's left edge.
PDM, as expected, provided full correspondence between the image and the original model, including its thin features.
The results of synthetic data processing demonstrate why pre- and poststack migrations provide not only different focusing of horizons (resolution and intensity) but also different depths of horizons in the environment of a salt dome.
Note that this model covers a wide variety of situations typical for prospects of the Precaspian basin.
Field seismic data
Numerous examples of seismic data processing and velocity analysis in the pre-Caspian basin testify to salt domes as a major reason of lateral velocity variation. Because mean thickness of salt grows up from just meters-or total absence-in the edges of the basin to several kilometers in the center, the lateral velocity variation correspondingly changes from minor in the margin zones to rather significant in the central parts of the pre-Caspian basin.
A great deal of seismic exploration in the pre-Caspian basin has been carried out in the margin zones, where the presalt targets are accessible for drilling. Within these zones, the salt shapes range from complex domes to layer-type structures up to full absence of salt.
Northern basin case
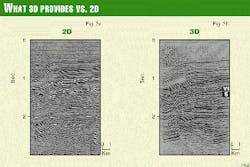
The first example deals with the basin's new prospect in the northern part, located near Karachaganak field (location 2, Fig. 1). The zone is characterized by a thin, pillow-like salt; therefore its roof, horizon VI, is distinctly identified on the existing data. However, the structure of the presalt section below its roof, horizon S, could not be clearly delineated despite a number of 2D lines that have been acquired (Fig. 3, at right).
Given the high potential of the presalt prospect, the existing data could not satisfactorily provide either the sufficiently detailed study of the structures between strong reflectors or the clear delineation of faults. Also, it was not possible to even identify horizon S. At the same time, a lot of velocity estimations testify to no essential velocity horizontal gradient in postsalt.
In these conditions, 3D data acquisition aperture-with 5,400 m in-line and 3,550 m cross-line, CMP gather spread and 54-fold, 25-by-25 bin size-the processing flow that included NMO, DMO, and poststack time migration, provides very good data. Horizon S was imaged uninterruptedly. All major features of the section that are related to the prospects were clearly delineated.
Eastern margin cases
The next two cases represent the eastern margin zone of the pre-Caspian basin, within which two presalt carbonate layers, KT-1 and KT-2, are the major exploration targets. The largest field in the region, Zhanazhol oil field, produces from these layers. The KT-1 layer thickness varies 300-500 m, the deeper KT-2, 400-700 m. The layers are separated by a terrigenous unit, with the thickness deviation ranging from a few to 300 m.
Both carbonate layers have been penetrated by a few wells around Zhanazhol field. But to the south (location 3, Fig. 1), KT-1 and KT-2 are not satisfactorily explored; exploration has been mainly related to the more-prospective KT-2. The KT-2 carbonates occur under the KT-1 carbonates; therefore, their seismic image is affected by both salt domes and the heterogeneity of KT-1.
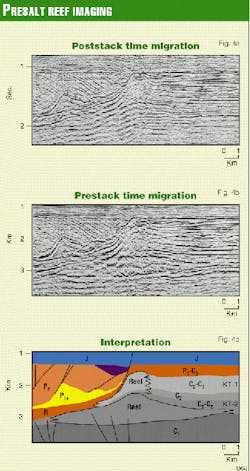
Based on the previous study carried out in the location area, a small salt dome and a reef within KT-1 were identified. By analogy with adjacent drilled areas, the presence of KT-2 was also assumed. However, based on the existing data, KT-2 could not be delineated under the salt dome and the KT-1 reef.
As a result of the data reprocessing with PDM application, much more-interpretable data have been obtained (Fig. 4). On the PDM section under the KT-1 reef and the salt dome, a lens-shaped body at the KT-2 depth range is clearly visible.
Interpretation of the new data along with the relevant data from adjacent areas allowed identification of a reef within KT-2 carbonates and clarified interrelations between different sedimentary units.
Carbonate step zone
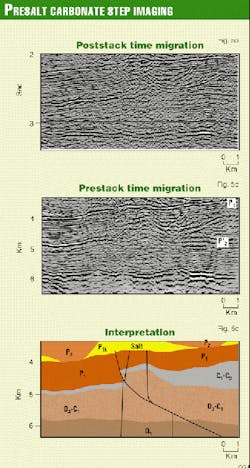
The next case study deals with a carbonate step zone in a presalt section to the north from the previous case, characterized by more-developed salt-dome tectonics. (location 4, Fig. 1). This carbonate step was formed by the KT-2 erosive surface; the KT-1 layer thins away to the east from the area. In the vicinity of the area, shallow-water carbonates in the eastern part are replaced by deepwater ones towards the western part of the zone.
The carbonate step was initially identified by a few wells that also discovered its overthrust nature caused by the Ural mountains growth. A salt ridge above the step complicates its study by seismic. However, a number of PDM-reprocessed data allowed the acquisition of generally new information on the KT-2 features in this zone.
On one of the reprocessed lines (Fig. 5), the roof of the presalt (horizon P1), as well as the KT-2 roof (horizon P(2), is coherently imaged. Importantly, PDM has focused fragmentary but distinctive dipping events that correspond to the surface of the overthrust. PDM reprocessing and reinterpretation of the step-crossing series of lines made it possible to confidently trace the step for about 50 km along the edge of the basin.
Normally, PDM is considered an effective presalt-structure imaging tool. But the accurate and velocity-verifying PDM modeling technique provides the basis for detailed study of postsalt horizons, even if lateral velocity variation is not predominant.
For postsalt structures, precise delineation of faults and identification of fault-horizon and horizon-salt flank contiguity points is critical, because faults and salt flanks seal the majority of postsalt fields of the pre-Caspian basin. Also faults often represent hydrocarbons' presalt-postsalt migration roots. At the same time, faults and salt flanks are usually poorly visible on the regular sections, due to diffraction-masking effects. Because the PDM technique provides advanced focusing of reflections and diffractions, it is very productive for exploration of the postsalt prospects of the pre-Caspian basin.
Central graben cases
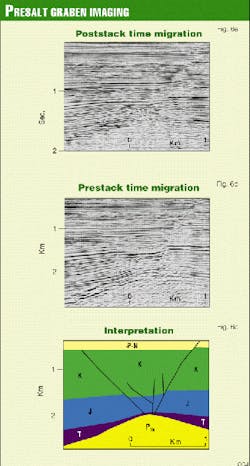
Let's consider two cases of successful PDM application in the central graben environment. Both prospects are located in the southwest premarginal part of the pre-Caspian basin (locations 5 and 6, Fig. 1). Fig. 6 displays the results along the line across the deep-roof salt dome. Due to the underdeveloped-dome nature, the postsalt horizons have generally kept their initial sedimentary character. On the regular section, the central graben is barely visible, even though the fault in the right part of the section can be recognized. The structure of the salt roof and the cover sediments are also poorly imaged.
The PDM section provides undoubted imaging of all major features of the graben, including the 90-m amplitude fault in the right part, the shiftless fault in the left part, and the salt roof area.
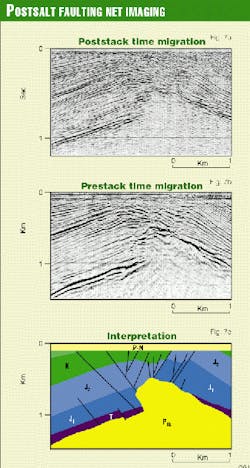
Another case demonstrates very high performance of PDM in a more-complicated environment (location 6, Fig. 1). The piercement dome causes the extremely complex structure of the postsalt.
Only after having applied PDM does it become possible to delineate the net of faults in Jurassic sediments and to identify the points of the postsalt Triassic horizons bordering on the salt flank (Fig. 7).
Apparently, effective migration implies that all necessary seismic events are accurately recorded and properly placed. This means that proper PDM imaging of even relatively simple salt-dome media requires 3D data with 4-5 km or more in-line and cross-line maximum offsets, 25-by-25 m or smaller bin size. One can easily assess that, for correct imaging of complicated environments, tens of thousands of recording channels and a huge number of shots will be needed.
However, the experience of new data processing and old data reprocessing for the pre-Caspian basin testifies that applying PDM even for data acquired with less-sophisticated technologies extracts new valuable information inaccessible by any other current technologies and provides really advanced imaging of salt-prone structures.
Acknowledgment
The authors thank First International Oil Corp., Japan National Oil Corp., and KazakhTurkMunay for the kind permission to use their data in this article.
The Authors
Kairat Z. Sydykov is president of Geotex, Almaty, Kazakhstan. Prior to that, he was chief geophysicist in several organizations in which he dealt with seismic data acquisition and processing technologies development. Sydykov also was an assistant professor in the Geophysical Department at the Kazakh Polytechnical University. He graduated from Kazakh Polytechnical University and has a PhD from the Moscow Gubkin University of Oil and Gas.
Mark B. Korostyshevsky is head of the depth migration group in the Geotex processing center in Almaty. Since 1955, he has been involved in research and development in the area of seismic data processing and interpretation in various organizations in Russia and Kazakhstan. Korostyshevsky has a PhD in geological-mineralogical sciences.
