Resurgent Oil Demand, OPEC Cohesion Set Stage For Optimistic Outlook For Oil Industry At The Turn Of The Century
There is guarded optimism that continued global economic expansion over the next 3 years will boost overall demand for energy, notably for oil and natural gas.
This makes the outlook promising for oil and gas companies that have adopted a strategy based on continued market growth rather than rising prices.
Expectations are for continued improvement in the economic situation in the developing countries and slow but steady growth in the industrialized nations. The chaotic political situation in the former Soviet Union makes projections of future economic activity difficult. But there is a good probability that the situation in the FSU will at least stabilize and post modest gains in economic activity over the next 3 years.
OPEC's success in reining in production, which tightened the market and significantly boosted depressed prices, is another contributor to a favorable outlook for the industry-not the least of which is the resulting boost in revenues that provides much-needed capital for future expansion.
Higher oil prices tend to be a double-edged sword. If prices get too high, that will tend to stifle demand and encourage consuming countries to take action to diversify and reduce energy supplies. On the other hand, the recent bout of depressed prices did not provide the industry with sufficient funds to invest in future needed supplies.
The industry looks favorably on the higher price level, but there remains some lingering doubt about OPEC's ability to maintain adherence to these quotas over an extended period. In addition, improved price expectations will encourage investment in non-OPEC supplies. So the threat of future oversupply and consequent downward price pressure still exists. But OGJ expects that oil prices will remain in a favorable range for industry investment over the forecast period.
During the 2000-02 forecast period, drilling will increase from recently depressed levels. Improved economics for oil drilling and an attractive portfolio of opportunities worldwide will help boost activity.
Refining capacity will expand to meet growing world demand for products. But expansion will be primarily in the developing countries, where demand growth is the strongest. In the mature areas, capacity may be reduced to help boost the utilization rate and improve margins.
Natural gas consumption and production will continue to increase and capture a growing share of the world's expanding energy market (see related article, p. 63).
Economic activity
The pace and location of worldwide economic activity will determine the level of demand for petroleum products over the next 3 years. Recovery in many of the Asian countries that are just beginning to emerge from a severe economic downturn will help boost oil demand in the near future. And continued steady growth in the industrial countries of Europe and North America will also sustain the level of petroleum product consumption. Resurgence in the developing countries is critical to demand growth, because economic growth in these countries is more closely tied to energy and oil consumption. The economies of Eastern Europe are generally expanding steadily, but the economic situation in the FSU is chaotic and its outlook uncertain.
Although improvements in consumption efficiency have cut the amount of energy required to produce a unit of economic growth, increasing economic output still requires boosting energy use. And the strongest economic growth over the net 3 years will be in the developing countries where nation-building takes precedence over improving energy efficiency.
Economic activity in the industrialized world, encompassing the countries of the Organization for Economic Cooperation and Development (OECD), has been growing at a modest but steady pace over the past few years. And this slow but steady growth is expected to continue over the next 3 years. The steady economic expansion has also boosted demand for petroleum products in the world's largest markets.
The pace of OECD economic growth has slowed somewhat over the past 3 years but has remained positive. According to data from the latest OECD economic outlook, the growth rate for real gross domestic product (GDP) for all of the OECD fell to 2.3% in 1998 from 3.3% in 1997. The Asian economic downturn was the major reason for the slowdown, as the economies of Japan and South Korea went into recession. GDP for the OECD countries is estimated to grow 2.2% in 1999. Although GDP in Japan is still sliding, the rate of decline is expected to be much smaller this year compared with last year. And South Korea is estimated to post strong GDP growth of 4.5% in 1999. Positive but slower economic growth in some of the major OECD industrial countries is expected to slow the overall growth rate slightly tbis year. GDP growth in Germany will slip to 1.7% from 2.8% in 1998. France's economic growth rate is projected at 2.3%, down from 3.2% the year before. And UK GDP growth rate is expected to fall to 0.7% from 2.1% in 1998.
The trend in economic growth in the countries making the transition from communism in Eastern Europe and the FSU has been mixed over the past 3 years. According to data from the latest world economic outlook by the
International Monetary Fund, the economies of the countries of Eastern Europe have posted economic growth of 3.1% in 1997, 2.4% in 1998, and about 2% in 1999. Offsetting that to some degree, chaos in Russia has resulted in a decline in economic activity. Russia posted GDP growth of 0.8% in 1997. But the Russian economy slid into recession in 1998, and GDP fell 4.8%. It is estimated that Russian economic activity will decline another 7% in 1999.
Economic growth for the other developing countries slipped in 1998 due to the financial problems in Asia and Latin America. For the developing countries as a group, GDP grew at a rate of 5.7% in 1997. The growth rate fell to 3.3% in 1998 and is expected to slide further, to 3.1%, this year. Economic growth in the Asian developing countries fell to 3.8% in 1998 from 6.6% in 1997. However, economic growth in these countries is forecast to increase to 4.7% in 1999. The level of economic growth in Latin America slipped from 5.2% in 1997 to 2.3% in 1998. The countries in this region as a group are expected to slip into recession in 1999, with economic activity falling 0.5%.
Energy and oil consumption in these regions mirrors the level of economic activity. Energy conservation is not a priority in the developing world, where improving living standards takes precedence. In these areas, energy demand still tends to move in step with economic growth.
Economic outlook
Conditions now appear favorable for steady economic growth in all regions-the OECD, countries in transition, and developing countries-throughout the 2000-02 forecast period. The major problem area is Russia, where political instability clouds the outlook.
GDP growth in the OECD countries is expected to continue in 2000 but at a slightly slower pace, 2.1%. Economic growth in the U.S. is expected to slow somewhat but this will be offset by improvements in economic growth in other major industrial countries. GDP growth in Germany is expected to rebound to 2.3% in 2000; in France, to 2.6%; in Italy, to 2.2% from 1.4% in 1999; and in the UK, to 1.6%. GDP in the group of smaller OECD countries will increase to 3.3% in 2000, from 2.8% in 1999 and 2.7% in 1998. OGJ is projecting that the group of OECD industrial countries will sustain an economic growth rate of 2.2%/year in 2001-02.
For the countries in transition in Eastern Europe and the FSU, the IMF is projecting GDP growth of 2.5% in 2000 vs. a decline of 0.9% in 1999. GDP growth for Eastern Europe is expected to increase to 3.7% from 2% in 1999. Russian economic activity is not expected to decline in 2000 but remain at the 1999 level. OGJ is projecting positive economic activity for the FSU in 2001-02. Economic activity for the FSU is projected to increase 2% in 2001 and 2.5% in 2002. The restoration of some political stability is expected and is required for any renewed economic growth in Russia.
The pace of economic growth in the developing countries is expected to improve over the forecast period. IMF is projecting GDP growth in the developing countries of an average 4.9% in 2000. Economic growth in the Asian developing countries is expected to move up to 5.7%. Latin America is expected to move out of recession and post a growth rate of 3.5% in 2000. OGJ is projecting that the economies of the developing countries of the world will grow at an annual rate of 4.5% in 2001 and 2002.
Energy
The translation of projections of economic growth into forecasts of energy demand rest heavily on assumptions about energy use intensity, which vary greatly among regions. Energy intensity, a measure of consumption efficiency, is the amount of energy consumed to produce a unit of economic output. This is usually measured in terms of BTUs of energy consumed per dollar of GDP.
Energy intensity in the OECD countries has declined since the 1970s because of investments in more energy-efficient equipment and other conservation efforts. In developing countries and countries in transition, investment has been concentrated on raising economic output rather than reducing energy consumption and related costs.
During 1988-98, OECD economies as a group grew by an estimated 27.3%, and energy consumption increased 13.8%. Energy consumption moved up only 0.5% for every 1% increase in economic output.
In the developing countries, aggregate economic activity increased an estimated 69.9%, while total primary energy consumption increased 46.5%. Energy consumption moved up 0.7% for every 1% increase in economic output.
For the economies in transition in the FSU and Eastern Europe, over this 10-year span, the level of economic and energy use both fell about 33%. Energy intensity has remained relatively constant, as a reduction in energy use followed the reduction in economic output.
OGJ expects that energy efficiency will continue to improve but to do so very gradually in the OECD countries. Energy consumption will increase at a rate of slightly less than 0.6% for every 1% gain in economic activity. OECD countries face continuing pressure to improve energy efficiency for environmental reasons. In addition, many of these countries' economies are in a transition from being dominated by heavy manufacturing to less energy-intensive service and information businesses. And there are always pressures to reduce energy use, to cut costs, and remain competitive in the world economy. Total OECD energy consumption at the end of the forecast period in 2002 will be up 3.9% from the estimated level for 1999.
Energy use efficiency is less of a political priority in the developing countries than it is in the OECD, but OGJ sees some improvement over the next 3 years. As the fast-growing developing nations expand economic output, they add more modern, energy-efficient capital equipment. OGJ projects that, in the developing countries, energy consumption will increase 0.85% for every 1% increase in economic output. At the end of the next 3 years, energy consumption in the developing countries will be 12.9% higher than estimated 1999 energy demand.
In the FSU, OGJ expects economic growth to resume over the next 3 years, accompanied by a modest increase in energy consumption. During the same period, energy demand in the FSU is projected to increase 0.9% for every 1% increase in economic output. FSU energy consumption in 2002 is projected to be up 3.5% from the level estimated for 1999. These projections for the FSU assume that there will be some further progress toward an orderly, market-oriented economy and that there will be no major political upheaval. There is a lot of room for improvement in energy efficiency in the FSU but few funds available to invest in more energy-efficient capital equipment.
Energy mix
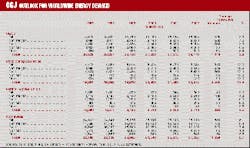
All of the major primary energy sources will contribute to the consumption increase during the next 3 years, although growth patterns will vary. Total worldwide energy demand in 2002 will exceed estimated 1999 consumption by 6.7%. Demand for energy will rise in each of the three designated regions: OECD, by 3.9%; developing countries, by 12.9%; and FSU, by 3.5%.
In the OECD, consumption will grow fastest through 1999 for energy from natural gas and the "other energy" category, which includes hydroelectric power, geothermal power, and miscellaneous small energy sources.
Natural gas will be the fastest-growing fuel in the OECD, with consumption in 2002 up 7% from the estimated 1999 level. The natural gas market share will climb to 23.1% in 2002 from 22.5% in 1999.
Oil energy consumption will increase 3.3% by 2002 in the OECD. The market share for oil, however, will slip to 42.8% from 43% in 1999.
The combined oil and natural gas share of the OECD energy market will move up to 65.9% in 2002, from 65.5% in 1999.
OECD coal demand will increase 3.3% by 2002, but coal's market share will slip to 21.2% in 2002 from 21.3% in 1999.
Nuclear power output in the OECD countries will climb only 0.3% by 2002 from current levels. The energy market share for nuclear will slip to 10.5% from 10.8% in 1999.
Demand growth for all other OECD energy sources will be 6.4% from 1999 through 2002. But the market share will is small and will remain at about 2.4% in 1999 and 2002.
Developing country demand
For the developing countries, all of the major energy sources will post double-digit percentage gains over the 3-year forecast period. Natural gas will be the fastest-growing energy source.
Demand for natural gas in the developing countries will be 15.5% higher in 2002 than in 1999. The natural gas market share in the developing countries will move up to 17.2% in 2002 from 16.8% in 1999.
Oil consumption in the developing countries will increase 12% between now and 2002. Oil's share of the market will slip to 42.8% in 2002 from 43% in 1999.
Oil and natural gas combined will provide 57.6% of developing country energy in 2002, the same as in 1999.
Demand for coal in the developing countries will climb 12.9% by 2002. The market share will remain at 37.7%.
Nuclear energy output is projected to increase 10% by 2002. The nuclear share of the developing country energy market will slip to 1.2% from 1.3% in 1999.
Energy from other energy sources in developing countries will move up 13% by 2002. The market share will remain at 3.5%.
FSU energy demand
In the FSU, increased energy needs will be met primarily by growth in natural gas consumption. However, there will also be increases in oil, nuclear, and other energy demand.
Demand for natural gas will move up 4.6% in 2002 from the current year level. The natural gas share of the FSU market will increase to 53.8% in 2002 from 53.2% in 1999. The FSU has the world's largest gas reserves, and this abundance will support the increase in consumption.
The rate of increase in demand for oil in the FSU will depend somewhat on the ability of the industry to sustain the level of oil production as well as exports-crucial to raising capital for economic development. Over the 3-year forecast period, demand for oil is projected to rise 3%. Oil's share of the FSU energy market will be 20.3% in 2002 compared with 20.4% in 1999.
Oil and natural gas combined will be 74.1% of the FSU energy market in 2002. The market share for oil and natural gas was 73.6% in 1999.
Consumption of coal in the FSU countries is expected to remain constant over the forecast period. Coal's market share of the FSU energy market will slip to 17.9% in 2002 from 18.5% in 1999.
Demand for energy from nuclear power in the FSU will be up 5.3% in 2002 compared with current levels. The nuclear market share will increase to 5.9% from 5.8% in 1999. Energy from other fuels will increase 3.6% and account for 2.2% of the market in 2002, the same as in 1999.
Energy demand worldwide
The net result will be a shift in the worldwide energy mix, with the nuclear market share declining and the market shares for natural gas and "other" energy sources increasing.
Worldwide demand for oil is expected to increase 6.1% by 2002 from the current level. Oil's worldwide market share will decline to 39.7% in 2002 from 40% in 1999.
Natural gas energy consumption worldwide is projected to move up 8.4% over the forecast period. The natural gas market share will climb to 24.2% in 2002 from 23.8% in 1999. The combined market share of oil and natural gas will climb to 63.9% in 2002, from 63.8% in 1999.
Worldwide coal consumption will increase 7.45% through 2002, primarily due to economic growth in China, where coal is a dominant energy source. Coal's share of the global market will shift to 26.4% in 2002 from 26.2% in 1999.
Expansion plans in the Far East and FSU will boost nuclear output 1.4% in the forecast period. Nuclear growth will be minimal in the OECD countries. The nuclear market share will slide to 6.9% in 2002 from 7.3% in 1999.
Energy from all other energy sources is expected to grow by 8.8% over the forecast period, due in part to hydroelectric expansion in China and other developing countries. The world market share for this category will remain at 2.7%.
Petroleum demand
Demand for oil will lag demand for energy overall and lag the growth rate for economic activity.
Worldwide consumption of petroleum will increase 6.1% through 2002 to an estimated 76.9 million b/d. This will be an increase of 4.4 million b/d from the 1999 level. The majority of the increase will be in the developing countries, where demand will rise by 2.8 million b/d over the next 3 years, to 26 million b/d in 2002.
In the OECD countries, demand will increase by 1.5 million b/d to 47.2 million b/d in 2002, despite the efforts in many industrial countries to reduce the role of oil as an energy source.
Many developing countries have limited energy options and remain dependent on oil as a low-cost, convenient energy source. Oil is particularly important in countries with few indigenous energy sources.
Petroleum consumption in the FSU is expected to reverse the recent trend and start to climb again during the next 3 years, as some stability returns to the economy. Oil demand growth will not keep pace with economic growth since natural gas will be the major fuel of choice for industrial activity. However, FSU oil demand will move up 3.1% by 2002 to average 3.73 million b/d.
The past decade
To some extent, the next 3 years will see a continuation of the general trend of the past decade, one of slowly but steadily rising oil demand in many area of the world. Over the decade, significant increases in the OECD countries and the developing countries were partially offset by a sharp decline in FSU demand for oil.
According to BP Amoco PLC's Statistical Review of World Energy, world oil consumption increased by 8.315 million b/d over the past decade to a total of 71.53 million b/d in 1998. OECD oil demand increased 5.73 million b/d to average 45.23 million b/d in 1998. Consumption in the developing countries increased 7.19 million b/d to average 22.6 million b/d-a 46.7% increase over the decade. These sharp increases in oil demand were partially offset by a decline of 4.605 million b/d in the FSU over the decade, to an average 3.7 million b/d in 1998.
Regionally, the strongest demand growth over the decade was in the Asia-Pacific region, where consumption increased 6.955 million b/d to 19.125 million b/d in 1998. There was particularly strong oil demand growth in China and South Korea.
Elsewhere, demand for oil increased by 1.115 million b/d in South and Central America to 4.635 million b/d in 1998. Oil demand in the Middle East increased 1.145 million b/d over the decade to 4.23 million b/d. Demand in Africa was up 530,000 b/d at 2.37 million b/d in 1998. Oil consumption in Europe increased 1.36 million b/d to 16.065 million b/d. And in North America, oil demand moved up 1.815 million b/d to average 21.405 million b/d in 1998.
Oil products
OGJ projects that consumption of all major oil product groups will increase in the coming 3 years in the OECD and developing countries. There are no product demand statistics available for Eastern Europe and the FSU.
The fastest growth will be in demand for middle distillates and the miscellaneous but growing category of "all other" products. Even fuel oil demand will rise significantly, as economic growth resumes in the developing countries.
Middle distillate demand outside the FSU and Eastern Europe will rise 6.3% through 2002 to 26.5 million b/d, as transport requirements increase with economic development. In many developing countries, highway truck transport is an essential element supporting economic growth, and this boosts diesel fuel demand.
Motor gasoline demand is projected to increase 6.2% to 23.1 million b/d in 2002. The number of automobiles and miles driven worldwide will increase significantly, along with an improvement in living standards. This will be partially offset by the increasing fuel efficiency of vehicles.
Fuel oil demand in the OECD and developing countries will increase 5.8% to 10.6 million b/d in 2002. The increase in fuel oil demand will depend greatly on a competitive price. Fuel oil faces intense competition from natural gas and from renewable fuels as countries tighten air emissions standards. In many of the industrial countries, fuel oil is being replaced by other energy sources for electrical power production. This is offset by demand in the developing countries, where there are few energy alternatives and fuel oil is required to boost electrical power generation.
Demand for "all other" petroleum products are projected to increase 6.4% to 12.1 million b/d in 2002. This category includes: petrochemical feedstocks, lubricants, asphalts, and myriad other petroleum-based products. Advances in technology are constantly yielding new products derived from petroleum, which keep this product category growing in volume and importance. Demand for petrochemical products is expected to grow at least as fast as OECD and developing country economies during the forecast period.
Oil supply
On the supply side of the oil market equation, the key question over the forecast period is the volume of oil needed from OPEC. OPEC's ability to maintain production at levels close to market requirements will be a key to sustaining industry growth.
OPEC continues as the supplier of last resort and continues to face stiff competition from other producers. In recent years, growth in non-OPEC production has helped to meet rising demand and prevent OPEC from boosting market share. This has been in spite of slumping oil production in the U.S. and FSU.
The decline in FSU output has been matched by the drop in demand in that region, and other non-OPEC output gains have more than offset the decline in U.S. production.
OPEC production has not kept pace with the market expansion, and member countries have not been able to recover revenues lost during periods of sharp price decline that resulted from increased production volumes.
But OPEC still has the ability to greatly influence the market. OPEC overproduction in 1997 and 1998 led to a supply glut and a sharp drop in prices, followed by a curtailment of much industry investment. And in 1999, the willingness and ability of OPEC to set quotas and curtail production balanced the market and helped to boost prices and revive industry activity.
During the next 3 years, OGJ expects oil demand to continue to grow, but non-OPEC output will not keep pace. The widening gap between growing oil demand and non-OPEC production growth will have to be filled with OPEC oil.
OPEC production
OPEC output of crude oil and natural gas liquids represented more than half of the world's production in the 1970s, but this dropped to only 30% by 1985. Overly aggressive pricing by the group discouraged demand and stimulated production elsewhere. Demand for OPEC oil fell from more than 31 million b/d in 1979 to 17 million b/d in 1985.
During 1988-98, OPEC's production and market share have risen. OPEC's total liquids production averaged 21.43 million b/d in 1998 and climbed to 30.73 million b/d in 1998. Its share of total world production was 33.9% in 1988 and 42% in 1998.
Rising OPEC output caused problems for the group and the industry in 1997-98. OPEC boosted output as demand growth stagnated due to the financial problems and economic downturn in the developing countries of Asia and Latin America. Higher OPEC and non-OPEC oil production flooded the market with volumes far in excess of demand, and prices plummeted.
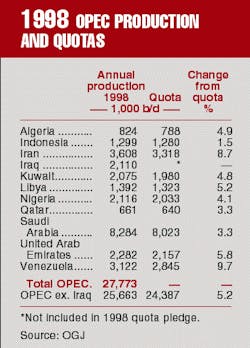
In the face of the lowest oil prices in more than a decade and falling oil revenues, the OPEC countries enacted a new quota agreement. In March 1999, OPEC members agreed to slash oil production to 22.972 million b/d. The quota excludes Iraq. According to OGJ data, OPEC oil output at the time had averaged 27.772 million b/d-excluding Iraq, an average of 25.662 million b/d. Adherence to the new quota would reduce world output by 2.7 million b/d.
The quota action by OPEC accompanied by restrained production by a majority of members, coupled with some resurgence in demand in the developing countries tightened the market in the second quarter of 1999. This put upward pressure on prices, and refiners scrabbled to lock in supplies. As a result, crude oil prices have risen to their highest level since the Persian Gulf crisis in 1990-91.
Looking to the future, there are two potential problem areas for OPEC. Iraq is not part of the quota agreement and has plans to increase production as rapidly as possible. Iraq has tremendous reserves potential and may be able to boost output rapidly when United Nations sanctions are lifted.
In addition, OPEC has a history of member countries violating quota agreements. It is questionable whether the current restraint will last over an extended period. Higher prices will stimulate competition as new non-OPEC supplies are developed. OPEC will then see some of its market share erode. This is a cycle that OPEC has had to contend with over the past 2 decades.
Non-OPEC production
Over the past decade, crude oil and condensate output has fallen dramatically in two of the world's largest producing areas, the FSU and US.
FSU output peaked in 1988 at 12.6 million b/d and has fallen steadily since then. Total FSU liquids output averaged 7.36 million b/d in 1998. U.S. total liquids production averaged 9.765 million b/d in 1998 and fell to 7.995 million b/d in 1998. Together, output from these two non-OPEC areas fell by 7 million b/d over the past decade.
This drop has been more than made up by production gains in other non-OPEC areas, which increased by 7.5 million b/d from 1988 to 1998. Non-OPEC liquids production, excluding the FSU and US, increased from 19.485 million b/d in 1988 to 27.02 million b/d in 1998. Total non-OPEC output averaged 41.845 million b/d in 1988 and 42.375 million b/d in 1998.
There were significant increases in North Sea production, which helped to fill the gap left by falling US and FSU output. The most dramatic increase was in Norway, where production moved up from 1.195 million b/d in 1998 to 3.215 million b/d in 1998. UK production increased from 2.29 million b/d in 1988 to 2.8 million b/d in 1998. There were also significant increases in other non-OPEC countries: Canada, 670,000 b/d; Mexico, 625,000 b/d; Argentina 410,00 b/d; Brazil, 415,000 b/d; Colombia, 385,000 b/d; Angola, 310,000 b/d; China, 465,000 b/d; and Malaysia, 185,000 b/d. And there were significant but smaller increases in many other countries.
These increases in producing areas throughout the non-OPEC world have frustrated past OPEC attempts to capture a growing share of the world market and regain influence over oil prices. Higher prices will stimulate exploration and production throughout the world. This may again be a problem for OPEC.
Reserves
Over the longer term, additional demand for crude oil will have to be satisfied primarily by increased production from OPEC countries, because that is where the vast majority of the world's oil reserves lie.
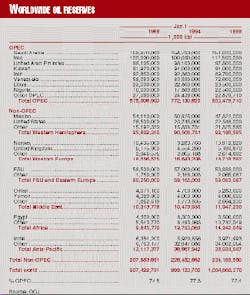
At the start of 1999, OPEC crude oil reserves totaled 800.5 billion bbl (OGJ, Dec. 28, 1998, p. 38). This was 77.4% of total world oil reserves. World reserves totaled 1.0347 trillion bbl.
At the 1998 rate of production, total OPEC reserves represent 79 years of supply.
Non-OPEC reserves at the start of 1999 were 234.2 billion bbl. At the 1998 rate of production, non-OPEC reserves represent only 16.6 years of supply.
Estimates of proven reserves are sensitive to both economics and new technology. Higher prices tend to increase the volume of reserves that can be exploited profitably. And new technology increases the percentage of recoverable reserves in place.
Therefore, it is anticipated that that the reserves in the non-OPEC areas will be able to yield production gains over the forecast period. At more attractive price levels, investment in the development of non-OPEC reserves will increase. It is expected that, over the forecast period, prices will be high enough to stimulate investment in these areas, and non-OPEC production will compete strongly with OPEC for crude oil markets.
Future capacity
Crude oil production capacity is expected to increase over the forecast period in both OPEC and non-OPEC countries. A number of OPEC countries have the reserves and plans to boost capacity when the market warrants the action-among them Saudi Arabia, UAE, Iran, and Venezuela.
Lifting the UN embargo that restrains Iraq output will unleash development in that country. Iraq has huge oil reserves and vast unexplored areas. It is expected that output will increase rapidly in the future, with production climbing to well over 3 million b/d, and possibly much higher.
Outside of OPEC, production capacity will continue to climb in a number of regions, including the North Sea, Latin America, West Africa, and Southeast Asia. These increases in non-OPEC output will be partially offset by the continued decline in US production and minor declines in other mature areas.
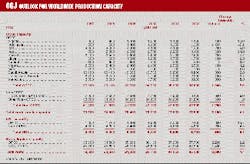
OGJ is projecting a 4.4% increase in worldwide liquids capacity by 2002, to 85.2 million b/d. This will be an increase of 3.6 million b/d. OPEC capacity will move up another 6.2% to 37.7 million b/d, and non-OPEC capacity will increase 3% to 47.5 million b/d.
The efforts by OPEC in 1999 to control output has increased the excess worldwide shut-in capacity. OGJ estimates that excess capacity amounted to 9.6 million b/d in 1999. This is 11.8% of total worldwide capacity and 13.3% of the demand for oil and NGL.
It is expected that demand will move up slightly faster than capacity over the forecast period. This will reduce the excess capacity worldwide to an OGJ-estimated 8.25 million b/d in 2002. That will represent 9.7% of total world capacity and 10.7% of expected 2002 demand for petroleum.
The capacity figures represent production capability under ideal conditions. Since excess capacity of an estimated 6-7% is needed to accommodate maintenance downtime and other contingencies, the estimated surplus is not extreme. Any excess capacity tends to moderate prices. However, the closing of the excess capacity gap indicates that there will be a lessening of potential downward pressure on prices over the forecast period.
Future output
OGJ is projecting that both OPEC and non-OPEC production will rise over the forecast period, in response to rising world demand for petroleum products, but OPEC output is expected to move up at a faster pace. Total world production will rise 6.9% over the forecast period to an average 76.95 million b/d in 2002.
Non-OPEC output, including the FSU, is expected to move up 1.95 million b/d from the 1999 level, to 44.25 million b/d in 2002. After a decade of decline, FSU production is expected to climb modestly over the forecast period. FSU output is projected to increase by 350,000 b/d to 7.65 million b/d. There is significantly more output potential in the FSU, but organizational and political problems are expected to restrain rapid growth.
Production from the other non-OPEC countries will move up by 1.6 million b/d to 36.6 million b/d in 2002. More countries are offering favorable terms and encouraging development investment by major international oil companies.
OPEC output will move up 10.1% over the forecast period to 32.7 million b/d in 2002. This will increase OPEC liquids output by 3 million b/d.
A continuing question is how the OPEC countries will finance all of the expansion of production capacity. Social programs and infrastructure investments begun in the era of high crude oil prices now drain producing-nation cash flow from oil operations. Increasingly, OPEC members have to look outside their borders for investment capital.
Some OPEC members continue to resist direct involvement of outside companies. And some have trouble borrowing from international lenders due to political instability or poor credit ratings. The organization has repeatedly appealed for international cooperation to guarantee markets for crude oil and investment sufficient to ensure steady development of their reserves. This appeal has met with little success.
This year, OPEC has successfully manipulated supply to boost prices. But there are perils associated with this strategy. Contrived price increases can discourage future demand and encourage consuming countries to take retaliatory market or political measures. If prices move much higher, there will undoubtedly be a political reaction from the major consuming countries. And that may not be in the long-term best interests of the OPEC countries.
Drilling activity
Worldwide drilling activity will increase during the forecast period, as exploration and production spending rises in response to higher oil prices.
The number of active drilling rigs outside of the U.S. and Canada is projected to increase from an estimated 610 in 1999 to 770 in 2002.
The U.S. rig count will also move up over the next 3 years, but the increased activity will be spurred mainly by natural gas drilling. The U.S. rig count will move up from an estimated 610 active rigs in 1999 to 780 in 2002.
Drilling in Canada will also rise over the forecast period. Active rig activity is expected to move up from an estimated 260 in 1999 to 340 in 2002.
The increase in drilling activity will not reflect the total increase in investment over the forecast period. A growing share of upstream investment is dedicated to non-drilling activities, such as sophisticated geological and geophysical analysis.
Refining
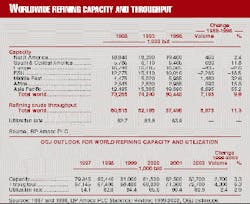
As demand for oil products plummeted in the 1980s, worldwide refining capacity fell from 78.5 million b/d to 73 million b/d in 1985. As demand recovered in subsequent years, refining capacity started to climb once again. During 1988-98, worldwide capacity increased 9.8% to 80.44 million b/d in 1998.
Efforts today are aimed at rationalizing capacity in mature markets and adding capacity in growth markets. Generally, rationalization means bringing capacity in line with a profitable utilization rate. When utilization rates are low, unit operating costs are high and refining margins are reduced. Boosting the utilization rate reduces costs and improves margins. In addition, there are efforts by refiners to replace old units with new equipment, reduce operating costs, and improve yield patterns to match changing product demand.
Shifts in capacity over the past decade changed from region to region. The largest increase was in the Asia-Pacific region, where capacity moved up 55.2% to 19.39 million b/d in 1998. Capacity in Central and South America increased 11.8% to 6.465 million b/d in 1998. Middle East capacity increased 32.6% to 5.935 million b/d in 1998. Capacity in Africa moved up 15.3% to 2.935 million b/d. Capacity in North America increased 2.4% to 19.4 million b/d. Over the same period, capacity in Europe slipped 2.6% to 16.305 million b/d. And FSU capacity fell 18.5% to 10.01 million b/d in 1998.
OGJ is projecting growth in worldwide refining capacity during the forecast period. With the utilization rates high in some regions, additional capacity will be needed to meet the expected increases in demand.
The growth will be regional, with the most significant increases coming in the developing countries, where demand growth is the strongest. New refineries will appear in growth markets where costs of compliance with environmental regulations are not prohibitive. There will be incremental additions to existing refineries in the U.S. as demand grows.
Some of the capacity growth worldwide will be offset by declines where there is currently excess capacity. This will occur in mature areas in Europe, where significant demand increases are not expected, and in the FSU, where capacity has not yet adjusted to the lower demand.
OGJ projects that total worldwide refining capacity will increase 3.3% over the forecast period to 83.7 million b/d in 2002.
Crude oil throughput will climb even faster in order to meet rising demand for petroleum products. As a result, the overall refinery utilization rate will also climb, improving refinery operating margins. Crude oil throughput at refineries is projected to increase 6.3% to an average 72.7 million b/d in 2002. The worldwide refinery utilization rate will move up from an estimated 84.4% in 1999 to 86.9% in 2002.
Prices - The economies of a number of rapidly developing countries in Asia ran into financial problems, and their economic output dipped sharply in 1997-98. That resulted in a sudden slowing of the pace of growth in world oil demand. Oil production capacity and output during that period was based on expectations of much higher demand. As a result, the market was flooded with available crude oil, and that put severe downward pressure on crude oil prices, which plummeted to their lowest level since 1986.
The average price of world export crude oil fell from $20.04/bbl in 1996 to $18.38/bbl in 1997 and then plummeted in 1998 to $11.92/bbl. All of the other price series followed this trend.
The price continued to slide in 1999, reaching an average low of $9.47/bbl for the second week of February and $9.87/bbl for the month. The OPEC ministers met in March to set a new production quota level that, together with similar production cuts by a few key non-OPEC nations, they thought would help tighten the market and boost prices.
There was an almost immediate price reaction to the new quotas and the apparent adherence by member countries. The average price of world export crude oil started to climb and moved up to an average $14.90/bbl for April. Prices climbed slowly at first, $15.27/bbl for May and $15.45/bbl for June. But as demand increased and refiners began to lock in crude supplies for the coming winter, the pace of the increases accelerated, and world export crude prices jumped to an average $18.08/bbl in July and $19.88/bbl for August. The price climbed to $21.73/bbl the second week of September. This was up 129% from the low point in February.
This higher price level is dependent upon tight supply in the crude oil market and continuing strong demand. It is doubtful that OPEC will be able to sustain this tight production discipline for an extended period. In addition, higher prices will help to stimulate increased investment in non-OPEC production capacity and output. Those two developments could put some downward pressure on prices by next spring.
But over the forecast period, OGJ is projecting conditions that appear favorable to support an acceptable price level, consistent with increased investment in new capacity. Demand growth is expected to be strong. And although there will be additional production capacity added over the forecast period, it is not expected to keep pace with demand. That will reduce the level of worldwide excess capacity and reduce potential downward pressure on prices.
There may be some volatility in prices over the forecast period, as OPEC struggles with a consistent policy for handling excess capacity. However, the success that the group had this year should make it easier for members to adopt new quotas that adjust the market balance whenever prices weaken.
