GEI Index tracks investments in select countries
Industry and government leaders, energy buyers and sellers, investors, and consultants have a new measure by which to check progress and monitor changes in energy investability among countries over a relatively short time.
The Global Energy Investment Index (GEI Index), introduced here, can assist in (a) setting business and government strategies relative to other markets in the oil, gas, and power businesses; (b) keeping abreast of country activities; and (c) serving as a measure of the pace of change in markets in transition. The GEI Index, to be published quarterly in Oil & Gas Journal, was developed by Enron Corp. and covers the 20 countries listed in Table 1. It rates countries according to 16 items grouped into 3 categories using a ranking system with a 100-point maximum.
The three categories are financial indicators, energy volume trends, and energy assets and energy market structure, including ownership patterns.
Financial indicators
The key financial and economic measures in the financial portion of the index are based on Institutional Investor (II) magazine's country credit ratings and Transparency International (TI) rankings. II ratings assess the economic, financial, monetary, and investment characteristics and business climate of countries on a twice-yearly basis. The GEI Index scores this indicator as 13% of a country's II rating. For example, in 1999 Australia received a 77-point II rating and thus scores 10 points toward the GEI Index.
TI, an organization that assesses market openness, price-setting, tariffs, and corruption conditions, rates countries on a 1-10 scale. The GEI Index scores countries at 50% of their TI ratings. For example, Norway, rated 9 by TI, receives 4.5 points in the GEI Index.
Energy volume trends
To measure the vitality of a country's energy economy, the GEI Index gives a maximum of five points for each of four energy-volume indicators and a maximum of two points for a fifth indicator, oil consumption growth.
The indicators:
- Is oil consumption increasing or decreasing? This is a strong measure of economic activity in a country that nevertheless reflects weather-based market sensitivity.
- Is domestic oil and gas production increasing or decreasing? This is a key measure, particularly for large exporters dependent on hard-currency earnings.
- Does the country hold large reserves of oil, and how fast are they being depleted?
- Does the country hold large gas reserves, and how fast are they being depleted?
- Is the country a major oil and gas producer: i.e., in the top 30% of global producers?
Energy assets, markets
The final category is a relative measure of openness to private investment in energy assets and the state of the country's transition from regulated to market mechanisms.
By moving up the scale, a country establishes a favorable investment climate for investors, customers, traders, and suppliers. These asset and energy market structure indicators measure the stages of market openness.
One set of data measures the electricity market, and the other set of data measures natural gas. As countries increase the level of private asset ownership and market-oriented reforms, they add points on the GEI Index.
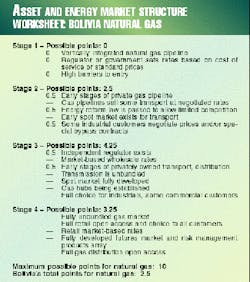
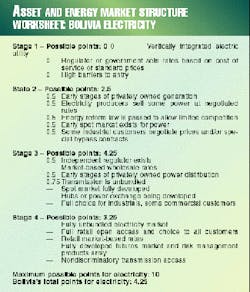
There are 20 subcategories within the worksheet. The sample worksheet for Bolivia indicates 2.5 points in the index for natural gas activities and 4.25 points for electricity (Tables 2, 3).
Remaining points in the energy asset and energy market structure category measure how much private ownership exists in electricity generation, electricity distribution, gas transmission, and gas distribution assets in a country, and the status of bilateral contract activity for electricity and natural gas in a country.
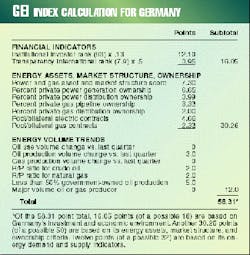
Table 4 shows how the GEI Index is calculated for a specific country, Germany in this example.
How countries fared
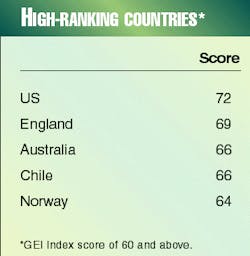
Table 5 highlights some of the results of the recent GEI Index rankings.
There are few surprises in the top-ranked countries. The US, England, Australia, Chile, and Norway are the top five countries in the GEI Index rankings. Each country in the top tier is progressing apace. But none exceeds the 90 points that would indicate a highly open, competitive energy market network.
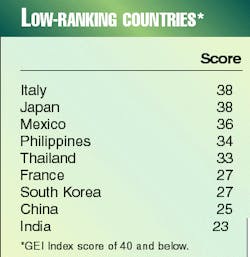
The group shown in Table 6 includes France, South Korea, China, and India in the early stages of opening their markets. Italy, Japan, Mexico, the Philippines, and Thailand are ranked higher in the group, indicating an improving pace toward market liberalization.
Index shifts
Because this is the first publication of the GEI Index, comparisons against prior quarters are impossible.
Changes in the data that would have caused movement in the rankings this quarter include strong gas production gains in Argentina and Australia. Large oil production decreases were evident in the US, England, Canada, China, and Norway and hurt those countries' ratings.
Spain and Thailand are speeding up their additions of shares of private power and gas assets.
The average country GEI Index in the second quarter of 1999 was 46 points (Table 1). For the same group of companies, the average score based on data from a decade ago was 36 points.
The tool
The GEI Index will track over time, for a select group of countries, performance against financial and economic indicators and activity in the areas of energy market liberalization and privatization.
Once an historic record is established, changes will indicate developments in the climate for energy investments.
Global energy industry investment rankings can reveal advances or reversals of conditions in both financial and energy activities in world energy markets. They can assist energy companies, investors, government officials, consultants, researchers, and sellers and buyers alike in market assessment and decision-making and in market-making activities.
