Prospect of arctic gas line leads to thermal simulation program
In 1996, Yukon Pacific Corp. began an in-house program to study the design of arctic natural gas pipelines that could operate according to a desired temperature profile.
The purpose was to make the pipelines more compatible with the soils in which they are buried.
The purpose of this on-gong project is to develop a design approach that, through temperature control, leads to lower capital-cost designs, reduces adverse temperature effects on the soils, and reduces the cost of mitigation for movement of the pipeline and development of differential stress on the pipe.
A review of software products found no commercially available pipeline-simulation product that could adequately predict operation of an arctic gas pipeline with interaction from the freezing and thawing effects of the subsurface and the seasonal variation of ground temperature.
Yukon Pacific, therefore, developed its own simulation by integrating a process simulator, a finite-element thermal model for soils, and geotechnical route databases. The resulting hydraulic simulation rigorously models the thermal interaction of the pipeline with the permafrost and nonpermafrost surrounding soils.
The simulation has proven valuable in evaluating designs for an 800-mile pipeline from Prudhoe Bay to Port Valdez, Alaska.
This article discusses the design issues for gas pipelines buried in permafrost and discontinuous permafrost soils, the simulation prepared to address these design issues, the recommended design approach, and the output of the simulation for one operating scenario.
Design issues
Buried cold regions natural gas pipelines traversing continuous permafrost and discontinuous permafrost soils are designed with consideration of both the beneficial and adverse impact of pipeline-operating temperatures on the surrounding soils.
Traditionally, design of such pipelines has first varied the pipeline diameter and compression power to minimize capital costs, then addressed the costs to mitigate the resulting temperature impacts on the surrounding soils.
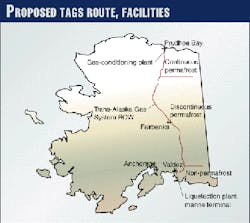
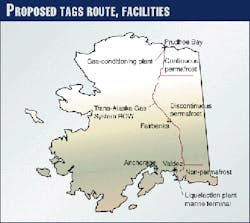
The Trans-Alaska Gas System (TAGS) pipeline is planned for a corridor with the existing Trans-Alaska Pipeline System (TAPS) oil pipeline.
The route traverses continuous permafrost in the north, discontinuous permafrost in the middle section, and nonpermafrost conditions in the southern section of the pipeline route (Fig. 1). TAGS will be buried throughout its length.
Design considerations for a pipeline operating in the "cold mode," that is, <0° C. (<32° F.), differ from a pipeline operating in the "warm mode," >0° C. In the warm mode, consideration must be given to uneven settlement of the pipeline from thawing of the permafrost sections.
Operation in the cold mode allows the burial of the pipeline in permafrost regions without thawing unstable permafrost soils and subsequent loss of support of the pipeline.
Cold operation of buried pipelines in discontinuous and sometimes even in continuous permafrost, however, may result in redistribution of moisture below the pipeline. This condition can cause upward movement, or "heave." The stress on the pipeline from differential heaving of subsurface soil sections beneath the pipeline may become unacceptable.
The potential for frost heaving (or thaw settlement) of the pipeline depends upon the size of the frost bulb (or thaw bulb) that develops around the pipe over time. Special design modes may be required where formation of these bulbs would induce otherwise unacceptable stresses on the pipeline.
The formation of frost or thaw bulbs depends upon the operating temperature of the pipeline, the physical properties of the surrounding soils, the seasonal heat balance at the surface of the ground, and the seasonal bank of thermal energy around the pipeline.
Permafrost areas thaw at the surface each summer. The thawed layer, also known as the active layer, varies in depth depending upon the type of soil, ambient air temperatures, and surface disturbance.
The depth of the active layer may be large enough to intersect the buried pipeline, thereby influencing the heat transfer through the wall of the pipeline.
Accurate prediction of the formation of the active layer is important for the modeling of gas pipelines in permafrost soils.
Although sharing the same transportation corridor, the current alignment of TAGS is more than 200 ft from TAPS except at a few locations where TAGS will cross TAPS. Interaction of the subsurface thermal regimes generated by TAGS and TAPS will be negligible as a result of the distance between the two pipelines.
Simulation software
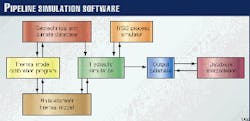
Fig. 2 shows a block flow diagram of the pipeline simulation developed. The simulation consists of three separate programs:
- A soil-thermal-model prediction program
- The hydraulic simulation program
- A program that integrates and interprets the output databases generated by the soil thermal model and hydraulic simulation program.
The physical parameters of the discrete pipe segments which define the pipeline alignment include diameter, wall thickness, elevation gain, segment length, soil properties, and climate data.
The lengths of the pipe segments are determined by the geotechnical staff and depend upon the resolution required to characterize soil conditions along sections of the pipeline.
The geotechnical database consists of standard Excel spreadsheets that contain the physical parameters for all of the individual pipe segments. The program reads the geotechnical data from the spreadsheets into variable arrays then prompts the user for the required facility data.
Currently, as many as 1,500 individual pipe segments may be input to describe the proposed 800-mile pipeline route.
There are many excellent process and hydraulic simulation software packages that can be used to model operation of pipeline segments, facilities, and physical properties of the gas.
It was known that one of these process-simulation software packages, HYSYS produced by Hyprotech Ltd., Calgary, featured OLE (object linking and embedding) compatibility. This allows unit operations in the process simulation software to be accessed by the authors' program code.
Pipe segments, compressors, chillers, valves, and other unit operations are placed in a HYSYS flowsheet. The simulation writes information to these unit operations, runs the operations, then retrieves the outlet parameters calculated by HYSYS.
Separate algorithms for determination of physical properties of the gas are not required because calculations are inherent in the HYSYS unit operations.
The program simulates facilities required to operate the pipeline in either a cold or warm mode. Two types of compressor stations can be modeled: stations with after-cooling of the gas, and stations without after-cooling.
The after-cooling can be configured to model mechanical refrigeration to achieve temperatures below 32° F. before reentering the pipeline. After-cooling using gas-to-gas heat exchangers and air coolers can also be modeled so that the discharge temperature is specified based upon a temperature approach to the station-inlet flow.
The user determines if the station is to be operated to control the discharge gas temperature local to the station or to achieve a predetermined set point at a downstream location. Constraints can be input for the maximum compression horsepower and chilling/cooling duty of the after-cooler.
The program provides for input of seasonal flow rates. The TAGS pipeline is primarily intended to deliver gas to an LNG facility and marine terminal in Port Valdez. The flow through the pipeline will vary with the seasonal capacity of the LNG plant.
Pipeline flow will be the lowest during the summer when the warmest ground temperatures will be encountered. Lower pipeline flow and summer ground temperatures combine to warm the gas pipeline operating temperature.
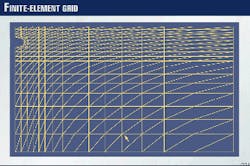
A two-dimensional finite element grid is used to model the soils surrounding the pipeline (Fig. 3).1 2 The finite-element model contains a surface heat-balance, accounting for both ambient air temperature and the insulating effects of snow. The finite-element model accounts for the latent heat of freezing of the moisture within the soil.
Input data for the finite elements include frozen and thawed soil moisture content, conductivity, and specific heat for soil layers to a depth of 35 ft. The model calculates the heat flux across the soils immediately next to the pipeline and determines the extent of the thaw or frost bulb around the pipeline.
A unique finite-element grid is generated for each simulation segment of the pipeline and stored in computer memory.
The finite-element grids are run to simulate the changes in the thermal condition around the pipe due to changes in seasonal climatic conditions and the interactive effects of the pipeline. Snow depth and ambient air temperature are determined for the particular day.
The climate data and average flowing temperature of the gas in the pipeline segment are applied to the boundaries of the finite-element grid. The grid thermal state is recalculated under the assumption that these boundary conditions are applied for a time step set by the user.
The finite-element grids model temperature gradients through the soil. Isotherms at 32° F. are of particular concern because they delineate the size of the frost or thaw bulb around the pipeline.
The depths of the 32° F. isotherm(s) located above or below each simulation segment are written to a database. These data are graphically presented to show the extent of the seasonal active layer of the soil and the depth of the frost or thaw bulb, if any, below the pipeline.
The geotechnical database, hydraulic simulation, finite-element thermal model, and output databases are coupled and managed by Visual Basic code.
Thermal calibration program
The data in the Excel geotechnical and climate database are calibrated to reflect prestart-up subsurface thermal conditions for the particular location of each pipeline segment. These calibrations are made from actual seasonal ground temperatures.
The calibration is performed by running the finite-element program with only the surface heat-balance option of the program. The operating temperature of the pipeline is not used, and the hydraulic simulation code is not run during calibration.
Seasonal variations are simulated by application to the grid of surface temperature and snow depths for a specific date, then recalculation of the thermal state for a prescribed time increment, typically 1 day.
Surface climatic data for the next date are read into the grid and the thermal state recalculated. This iterative process continues until the year-to-year seasonal variations in subsurface thermal conditions are unchanging. After this convergence, the simulation results are compared against actual field conditions and the input parameters adjusted as required better to simulate this prestart-up condition.
All of the isotherm temperature data from each iteration are written to a database. The minimum, mean, and maximum temperatures at various depths are recorded to a database during the last 2 "years" of the thermal simulation.
These temperature data are plotted as a function of depth to generate a seasonal subsurface temperature profile for the location. The shape of the ground temperature profiles, the depth of the active layer, and the dates at which the active layer begins to form in the spring and freezes back in the fall are all important aids in calibration and verification.
Simulation program
The hydraulic simulation is designed to generate a series of pressure and temperature profiles of the pipeline over time. Characterizations of the surrounding soils are also generated for the same period.
First, the calibrated finite-element grids for each discrete pipeline segment of the alignment are run for 5 simulation years to ensure that the grids are at thermal equilibrium and accurately portray prestart-up subsurface conditions. The hydraulic portion of the simulation is then started and generates a pressure and temperature profile along the pipeline.
Next, all of the thermal states in each finite-element grid are recomputed based upon the pipeline temperatures generated from the previous hydraulic run, surface climate conditions, and the time step input by the user. The heat flux for each pipe segment is estimated by calculating the heat flux across the finite elements immediately adjacent to the pipeline.
The heat flux for each pipe segment is adjusted for the length of the segment and used as the duty input for the pipe-segment unit operation in HYSYS. The hydraulic portion of the simulation is rerun with these duties to generate a new temperature and pressure profile.
This iterative and interactive process between the thermal models for each pipe segment and the hydraulic simulation continues, using the assigned day time step until the analysis duration is complete, typically 1-10 years. Data from each time step are stored in databases.
Simulation setup requires 10-20 min, depending upon complexity of the particular scenario. Once started, the simulation runs unattended. The author runs the simulation on a personal computer with a Pentium 450 processor. The simulation takes about 30-90 min for each calendar year simulated, depending upon the number of pipe segments and iteration time step used. The size of the output database can vary from 30-80 megabytes.
Sample simulation, results
The following sample configuration was selected to illustrate some of the temperature-control techniques being evaluated for use on the proposed TAGS gas pipeline.
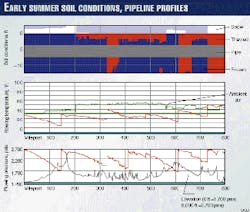
Fig. 4 shows a pressure and temperature profile for a 36-in. gas pipeline running from the north slope of Alaska to Port Valdez with an average annual gas throughput of 2.2 bcfd.
This configuration uses:
- A compressor with mechanical refrigeration to cool the discharge gas to less than 32° F. (Mile Points [MP] 144 and 410).
- A compressor with cooling of the discharge gas to a minimum 15° F. approach to the inlet gas (MP 610).
- A small compressor used to raise the flowing temperature to just below freezing (MP 483).
- Compressors used to maintain a constant temperature at downstream locations (MPs 327 and 726).
The configuration also uses two Joule-Thomson (JT) valves to provide a discrete and controllable transition from warm to cold operation of the pipeline. This configuration differs from previous pipeline designs in that multiple transitions from warm to cold and cold to warm operation are used.
The gas is chilled before entering the pipeline. Mechanical refrigeration is used at Station Nos. 1 and 3 (MPs 144 and 410) to chill the discharge gas to a constant 28° F. temperature before entering the pipeline.
The refrigeration facilities are expensive to install and operated at full design capacity only during the short summer season and early autumn.
Partial cooling is used instead of refrigeration at Station No. 5 (MP 610). This cooling system cannot chill the gas to below 32° F. during the summer. The downstream pipeline, therefore, is operated in the warm mode.
A JT valve is used to make the transition from warm to cold mode. The simulation adjusts the station discharge temperature so that the temperature at the inlet to the JT valve is maintained at a constant 33° F. The JT valve induces enough pressure drop to cool the gas to 30° F., thereby providing a controlled transition from warm to cold mode operation.
A controlled transition from warm to cold operation is required to prevent temperature cycling at the transition point. Rigorous simulation of the pipeline operating temperature is required to determine if the warm sections will remain warm during the winter season without operating so hot in the summer that excessive thaw settlement occurs.
Station No. 2 (MP 327) has no after-cooling. The discharge pressure of this station is raised or lowered as required to maintain 33° F. at the JT valve downstream.
Raising the discharge pressure increases the discharge temperature of the gas, increases the flow efficiency through the downstream pipeline, and reduces the JT coefficient of the gas. All three of these factors tend to raise the downstream temperature profile.
Conversely, lowering the discharge pressure will reduce the downstream temperature profile. This type of compressor operation is promising as a cost-effective way to control temperature in both warm and cold operating modes. Compressors and compressor drivers in this service must be designed to accommodate varying compression ratios encountered throughout the year.
Station No. 4 (MP 483) also has no after-cooling. The discharge pressure of this station is raised only as much as required to maintain a constant 30° F. discharge temperature year round. The compression ratio across this small unit is approximately the same year round.
The soils downstream of Station No. 6 (MP 726) are thaw stable. Thus, temperature control consists of simply maintaining a warm operation year round.
The discharge pressure of this station is raised or lowered to obtain the pressure and temperature conditions at the end of the pipeline which are the most favorable for operation of the gas liquefaction plant. Exact temperature control downstream of the station is not required.
Fig. 4 shows operating conditions as of June 1. The seasonal active layer is forming along sections of the pipeline where the snow has melted. The plot shows that the ground around the pipeline segments operating in the warm mode are thawed. The soils around the chilled portion of the pipeline are frozen.
Stresses may be induced on the pipeline from differential heaving of the soils along the route. Thawing then refreezing of the soils around the pipe may relax these stresses.
The simulation allows the pipeline to thaw by turning off the after-cooling facilities, thereby allowing the discharge temperature to float depending upon the compression ratio across the station and the inlet gas temperature.
The simulation gradually increases the discharge temperature to the maximum allowable subject to the temperature of the gas entering the station and the compression ratio across the station.
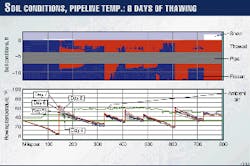
Figs. 5, 6, and 7 show the simulation results for such a thawing and refreezing operation. Fig. 5 shows the soil conditions 8 days after start of soil thawing on June 1.
The pipeline portion north of the first station is not thawed because differential heaving is not anticipated in the continuous permafrost soils encountered on the North Slope of Alaska. Thaw bulbs are forming in the previously frozen soils and are propagating downstream.
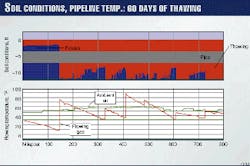
Fig. 6 shows the soil conditions 60 days after the start of thawing. A thaw bulb surrounds the entire pipeline downstream of Station No. 1 at MP 144.
Enough thermal energy has been banked in the soils surrounding the pipeline downstream of Station No. 5 (MP 610) so that the operation of the after-cooling facilities is required to maintain the 33° F. downstream target.
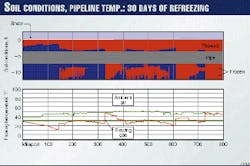
Fig. 7 shows the soil conditions 30 days after the chilling and cooling facilities have been turned back on. The soils downstream of the chilled stations are refreezing radially from the pipeline.
The temperature profiles downstream of the unchilled stations (MPs 327 and 483) cannot be effectively controlled until the temperatures at the inlet of these stations return to normal.
The pressure drop across the JT valves is limited during initial refreezing because extremely high differential pressures would be required to cool the gas to 30° F. The soils under the pipeline do not completely freeze back until the middle of the following winter.
Next steps
The simulation estimates the dimensions of the frost and thaw bulbs along the pipeline. Data from the simulation will be added to the geotechnical database for use with the bulb dimensions to estimate frost heave and thaw settlement along the pipeline.
The authors, with the help of Alaskan experts on the thermal effects on soils, have gathered historical climate data throughout Alaska and specifically along the pipeline corridor. Currently the simulation uses climatic mean conditions to model seasonal impacts on pipeline operation.
The authors intend to modify the simulation to model 20 years of pipeline operation based upon climate data measured over this period.
A transition from warm to cold mode between compressor stations avoids high temperatures encountered if the segment were designed to operate entirely in the warm mode, or low temperatures if the segment were designed to operate entirely in the cold mode.
Avoidance of relative high or low temperatures is a means of mitigating thaw settlement or frost heave. Other means include over excavation of the trench with select backfill or use of extra thick wall pipeline, both of which are relatively capital intensive.
The small pressure drop across the JT valve (5-10% of the maximum operating pressure) that provides a discrete temperature transition from warm to cold results in a slightly larger compression ratio at the downstream station and a corresponding increase in fuel consumption.
Further work is required to determine if this temperature-control method of mitigation is economically preferable to other means of mitigation for thaw settlement and/or frost heave.
Verification
The design of an arctic natural gas pipeline must account for the interaction of the pipeline's operating temperature resulting from seasonal gas flow and the associated Joule-Thomson cooling of the gas, the physical properties of the surrounding soils, the seasonal heat balance at the surface of the ground, and the seasonal bank of thermal energy around the pipeline.
Coupling a finite-element thermal model with an hydraulic simulation allows these interactions to be evaluated for all seasonal combinations encountered throughout the year.
The coupled model allows us to verify that from winter to summer and with varying throughput, a pipeline can be configured so that the warm sections of the pipeline stay warm and the cold sections of the pipeline stay cold. As a result, there is no sequential freezing and thawing of the soils around the pipeline.
Additionally, operating temperatures that exacerbate frost heave or thaw settlement in areas of susceptible soils (Miles 327 through 525 and Miles 610 through 726) can be avoided.
We have uncovered more than one pipeline configuration that provides better temperature control with the same or lower costs than arctic pipelines employing only chilled stations.
Use of small compressors to adjust the pipeline-operating temperature at critical locations provides effective control while also reducing the horsepower requirements at the downstream stations by raising the suction pressure. Use of multiple transitions between cold and warm operating modes also provides effective temperature control.
We could not have evaluated the various pipeline configurations without the simulation software we developed. The ability to view multiple temperature and pressure profiles simultaneously proved useful for both understanding the reaction of the system to seasonal influences and developing subsequent design strategies.
The software continues to evolve as more is learned about the operation of cold region pipelines.
References
- Segerlind, Larry J., Applied Finite Element Analysis, New York, John Wiley & Sons Inc., 1976
- Lunardini, Virgil J., Heat Transfer in Cold Climates, U.S. Army Cold Regions Research and Engineering Laboratory, New York, Von Nostrand Reinhold Co., 1981.
The Authors
Michael Metz is manager of pipeline engineering for Yukon Pacific Corp., Anchorage. He is an engineering geologist with 26 years' experience in cold-regions pipeline design. Metz holds a BS (1967) in geology from Kansas State University and an MS (1970) in geology from Washington State University.
Ward Whitmore is manager of process engineering for Yukon Pacific Corp. where he has worked for 9 years. A process engineer with 20 years' experience in design and operation of natural gas processing facilities, Whitmore holds a BS (1979) in chemical engineering from the University of Michigan.
