1998 E&P costs rose while performance fell
Despite the upstream petroleum industry's poor financial state last year, capital spending levels remained about even with the previous year.
This is one of the key findings noted by Arthur Andersen in its 1999 Global E&P Trends report, released recently (OGJ, Aug. 9, 1999, Newsletter).
To compile the report, Arthur Andersen surveyed 182 publicly traded companies, each with proved oil and natural gas reserves of more than 5 million boe. The companies were classified as: majors (integrated firms with reserves of more than 1 billion boe), large independents (with reserves of more than 200 million boe), medium-sized independents (with 50-200 million boe), and small independents (with 5-50 million boe).
Among Arthur Andersen's findings was that production costs and production replacement rates fell while reserve replacement and finding and development costs rose.
"On the surface, 1998 was a year of apparent contradictions, with revenues, profits, cash flow, and prices down, but spending up, despite higher costs," said Victor Burk, Arthur Andersen's managing director of energy industry services.
One reason for these apparent contradictions is structural, says Burk: "Exploration and development spending cannot be turned off and on like a faucet. In some instancesellipsecontractual obligations with drilling contractors and other suppliers require that work continues."
Another reason capital spending remained essentially constant last year was that companies at first believed prices would recover before yearend. But by mid-year, when prices were continuing to decline, companies decided to cut spending, says Burk.
As a result of last year's poor performance, many companies were forced to take non-cash impairment write downs. These totaled more than $17 billion, industry-wide, according to Arthur Andersen.
E&P spending
U.S. upstream capital spending declined for the first time in the 5-year history of the survey. It fell by 2% vs. 1997 to $37.2 billion. This decline was offset, however, by a 9% increase in capital spending in Europe and a 25% rise in the Africa-Middle East region.
"A decline in proved property acquisition costs was primarily responsible for the overall (U.S.) decrease," said Arthur Andersen. This is because costs in this category fell 11%, from $8.9 billion in 1997 to $7.9 billion in 1998.
Occidental Petroleum Corp. was last year's largest acquirer of proved properties in the U.S., with acquisition costs of $1.8 billion, largely related to its purchase of California's Elk Hills reserves from the U.S. government. Chesapeake Energy Corp. was second with $662.1 million, followed by Vastar Resources Inc. at $463.4 million (largely the result of its purchases of Gulf Coast reserves from ARCO and Mobil Corp.).
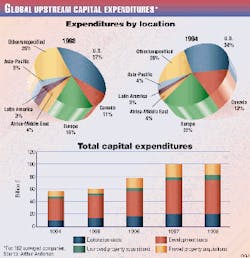
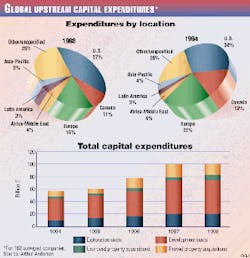
Unproved property acquisition costs slipped 3% to $4.2 billion in the U.S., while global unproved acquisitions increased by 1% to $7.6 billion (Fig. 1).
Capital spending by the majors declined 15% in the U.S. but rose 22% worldwide. In comparison, independents increased their capital outlays in the U.S. by 7% while cutting back by 13% globally, says Burk.
Worldwide, upstream capital spending was up 2% to $102.4 billion. Spending increased in all categories except proved property acquisitions, where outlays dropped 10% to $19.4 billion.
Among the U.S. spending categories, exploration costs jumped by the largest increment, rising 8% to $7.6 billion, while development spending dropped 2% to $17.5 billion. Exploration spending dropped 6% in Europe to $2.7 billion and 4% in Asia-Pacific to $827.5 million.
Since 1994, Europe has experienced the largest decline in its share of global spending-from 22% in 1994 to 16% in 1998. "The majority of this shift has been to the 'Other/unspecified' (category), which has grown from 20% of (global) spending in 1994 to 26% in 1998," said Andersen. "'Other/unspecified' includes amounts disclosed by companies that were not identified with specific regions.
"One of the biggest surprises of the survey is that (U.S.) exploration and development costs, including unproved property acquisition costs, rose from $29.0 billion in 1997 to $29.3 billion in 1998-a 1% increase," said the company. Worldwide, E&D costs increased 5% to $83 billion.
Reserves, production
U.S. oil reserves at yearend 1998 fell 5% to 19.1 billion bbl, the largest decrease in the survey period, says Arthur Andersen. Global yearend oil reserves increased 3% to 73 billion bbl in 1998.
These changes occurred because more companies moved their search for oil and gas to more promising areas outside the U.S., noted Arthur Andersen. Canada and the Africa-Middle East, Asia-Pacific, and Other/unspecified regions contributed to the global increase, while the U.S., Latin America, and Europe reported declines.
Purchases of U.S. oil reserves decreased from 1.4 billion bbl in 1997 to 817.5 million bbl in 1998. Occidental led the buyers, with 318 million bbl in acquisitions. Global purchases of oil reserves decreased 40% to 2.2 billion bbl as a result of decreased spending on proved property acquisitions.
U.S. sales of oil reserves decreased 40% to 412.4 million bbl. The companies reporting the largest sales in the U.S. were Texaco Inc. with 68 million bbl, BP Amoco plc with 51 million bbl, and Occidental with 46 million bbl. Non-U.S. sales of oil reserves decreased 34% to 1 billion bbl.
Worldwide gas reserves rose 5% to 356.4 tcf in 1998.
In the U.S., however, 1998 was the third consecutive year of flatness in natural gas reserves growth, totaling 107 tcf. Canadian gas reserves increased 8% to 32.2 tcf last year, and Latin America posted a 16% increase to 13.4 tcf. In Europe-the only region reporting a decline in this category-gas reserves dropped 2% to 73.6 tcf.
Royal Dutch/Shell had the largest global yearend gas reserves, with 60.5 tcf. BP Amoco had the largest yearend U.S. gas reserves, with 11.3 tcf.
U.S. oil production was down to its lowest level in the 5 years of the survey, says Arthur Andersen. It fell 1% to 1.7 billion bbl for the year. BP Amoco was the leading U.S. producer at 283 million bbl, followed by ARCO at 192 million bbl.
Worldwide, oil production increased 4% to 6.4 billion bbl in 1998. "The global increase includes the results of a high level of Asia-Pacific exploration activity (in previous years)," said Arthur Andersen. Oil production in the Asia-Pacific region increased 2% to 301.6 million bbl.
"BHP and Exxon, combined, accounted for 51% of Asia-Pacific production," Arthur Andersen noted.
Global gas production increased 3% to 26.9 tcf in 1998, with U.S. production up 3% to 11.8 tcf.
Performance measures
Arthur Andersen evaluated E&P industry performance in 1998 by tracking five key performance measures. Fig. 2 shows the results for two of these: reserve replacement and finding and development costs.
Industry performance in 1998, as gauged by the five measures, worsened in all categories except production costs.
Here are the key findings:
Worldwide replacement costs increased to $5.53/boe. Here, Royal Dutch/Shell led the majors with a 3-year average of $2.74/boe, and Triton Energy Ltd. led the large independents with $1.82/boe. Pacalta Resources led the medium-sized independents with $2.56/boe.
Among U.S. majors, Exxon had the lowest 3-year average finding and development cost at $3.62/boe. Cross Timbers Oil Corp. was the top large independent with $3.19/boe, and Gothic Energy was the leading medium-sized independent with $4.27/boe. Worldwide, Royal Dutch/Shell led majors with $2.70/boe, and Triton Energy led large independents with $1.82/boe.
Canadian F&D costs increased 73% to $7.17/boe, and those in Europe rose 15% to $8.29/boe. Africa-Middle East F&D costs climbed 23% to $3.73/boe.
"The major reason for the increase in reserve replacement costs and in finding and development costs during 1998 was the large downward revisions companies were required to take as a result of lower oil and natural gas prices," Burk explained.
Global oil production replacement through the drillbit dropped from 165% in 1997 to 120% in 1998. U.S. F&D-related oil replacement also fell, from 137% to 26% in 1998. These declines are also attributed to declines in extensions, discoveries, and revisions.
The U.S. all-source natural gas production replacement rate was 104% last year, continuing a downward slide from a 5-year high of 130% in 1994. Global gas production replacement from all sources declined from 165% in 1997 to 158% in 1998. U.S. gas production replacement through F&D fell from 94% in 1997 to 88% in 1998. Worldwide, F&D gas production replacement remained at 139% for the second year running.
Lessons learned
Burk says three lessons can be learned from the 1998 experience.
First, both price uncertainty and the inability to forecast prices are still problems. Second, companies must develop strategies to survive in a low price environment, if and when prices decline again, by managing and reducing costs. Third, many companies must rethink their views on mergers and acquisitions as a strategy to achieve large cost reductions. At the same time, however, they must realize the repercussions of these mergers, acquisitions, and layoffs, which can eliminate knowledgeable and skilled employees.
"The industry has been on a roller coaster," he said. "The companies that have survived and prospered are those that have learned from both the highs and lows and have been able to adapt to the forces that have dramatically changed this industry.
"The successful E&P company must be able to proactively react," Burk added. "Every company reacted in one way or another to the drop in oil prices, but the successful ones reacted proactively with a plan not only for surviving but for creating opportunities during the low-price environment."

