Roles of flow, metal studied in UK corrosion failures
Failures on pipelines in the Wytch Farm, U.K., crude-oil gathering system in 1997 provided the opportunity to study the separate influences of flow and metallurgy on corrosion.
High-quality inspection data, comprehensive as-built records, and stable production conditions came together to afford the chance. The flow regimes in the pipeline ranged from low-velocity, stratified flow to high-velocity, slug flow.
The inspection data showed that turbulent flow increases the frequency of corrosion pits and, for weld corrosion, the mean corrosion rate.
The pipeline consists of two grades of steel and was welded with two types of welding consumables. One grade of pipeline steel corroded at a significantly higher rate and with a higher frequency of corrosion pits than the other, apparently similar steel.
No significant relationship was found between weld metallurgy and corrosion rate or frequency.
Wytch Farm gathering station
The Wytch Farm oil field lies on England's south coast and is the largest onshore oil field in Western Europe.
In 1997, one of the Wytch Farm production pipelines failed from internal corrosion. After repair, the pipeline was returned to service but failed again. The failure locations were significantly different in their metallurgies and flow regimes.
The second failure prompted a thorough re-assessment of the condition of the pipeline. This involved large-scale excavations for inspection and repairs as well as re-analyzing intelligent pig data gathered several months earlier.
These data, combined with knowledge of the materials of construction, flow regimes, and fluid properties, produced a rare insight into the relationships between metallurgy, flow regime, and corrosion mechanism.
The Wytch Farm gathering station receives oil from remote well sites via pipelines, ranging from 89 mm to 324 mm OD. The route of each pipeline takes it via several well sites.
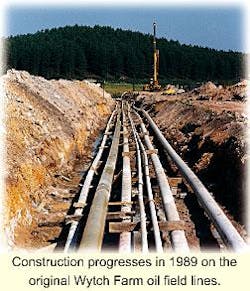
The 10-in. Wytch Farm pipeline was installed by three contractors during 1987-88, including a 1,100-m directionally drilled section which passes under Poole Harbor. It was commissioned in 1990.
The pipeline is unusual in being constructed from two grades of line pipe, API 5L Grades B and X-42. These were generally arranged in sections, but some line-pipe spools were distributed randomly along the pipeline length. The same manufacturer produced both grades of line pipe of the same nominal 7.8 mm W.T. by the seamless process.
As-built records allowed the location of each line-pipe spool to be determined. Each construction contractor used a different welding procedure; two of the contractors used similar C-Mn welding consumables, while the third used a consumable containing 1% Ni. Again, the as-built records allowed the contractor responsible for each weld to be identified.
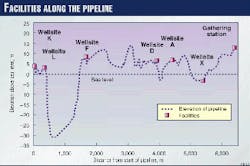
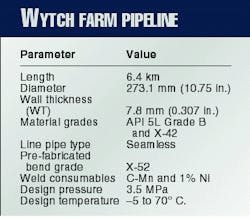
Fig. 1 shows the well sites and the topography of the pipeline, including the harbor crossing from Well Site L to Well Site F. Table 1 gives some general information about the pipeline.
The pipeline is a constant-diameter trunk line, connecting six well sites to the gathering station. Although fluid properties from each well site are similar, the addition of fluids at successive well sites and gas expansion from pressure drop combine to produce significantly different flow regimes along the pipeline's length.
Based on multiphase flow regime modeling, the flow regimes range from stratified flow at the inlet of the pipeline at approximately 1 m/sec to slug flow, bordering on annular flow at 10 m/sec at the outlet.
The pipeline also varies in elevation by 45 m (Fig. 1); this induces changes in the flow regime, discussed presently.
Damage discovered
Results of a high-resolution magnetic flux leakage (MFL) intelligent-pig inspection of the pipeline in late 1996 showed internal corrosion along the length of the pipeline, totaling 281 defects.
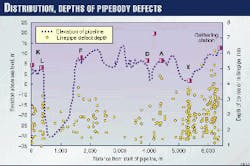
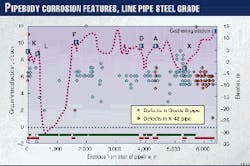
The frequency of defects increased towards the gathering station, particularly downstream of Well Site X (Fig. 2). The defects were believed to be restricted mainly to pipe body defects, with only limited indications of corrosion within the girth welds.
In June 1997, two failures occurred, one at the upstream end of the line close to Well Site K and one on the downstream end of the line within the boundary of the gathering station.
Pitting corrosion at the girth welds caused the failures. Small diameter (about 10 mm) pits were found to be entirely in the weld. The intelligent pig inspection had given no indication of the presence of these features. (Small corrosion features in welds are difficult to identify with MFL techniques.)
Manual inspection with gamma radiography and compression wave and time-of-flight diffraction ultrasonic thickness (UT) measurements revealed widespread girth-weld corrosion. Approximately 30% of the pipeline's girth welds were excavated and inspected.
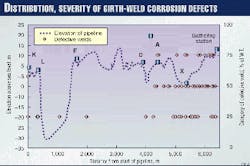
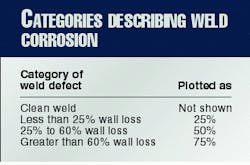
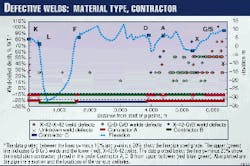
Improved interpretation of the intelligent pig data, based on results gathered by the manual-inspection program enabled generation of a complete picture of the condition of the pipeline. The analysis of weld corrosion was semiquantitative, placing corroded welds into four categories (Fig. 3):
- Clean welds
- Less than 25% wall loss
- 25% to 60% wall loss
- Greater than 60% wall loss.
For clarity, they are plotted against discrete percentages of wall thickness (Table 2).
Fig. 3 shows that the distribution of corroded welds follows a similar distribution to the pipe body defects; that is, increasing in frequency towards the gathering station.
In this case, the effect is more significant as there were virtually no defective welds between the pipeline inlet and kilometer point (KP) 4.0, while there were significant numbers of pipe body defects in all sections.
Also, the weld defects in upstream sections were less severe than those downstream.
Corrosion mechanism
The production fluid at Wytch Farm is a sweet, light crude oil, and the pipeline had been in service for approximately 7 years.
Changing field conditions often complicates investigations into corrosion mechanisms in the field, but not in this case: The produced fluid composition had remained essentially constant. The water cut had remained constant at approximately 30%.
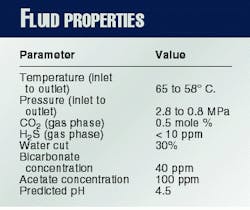
There was also no evidence of seawater breakthrough, scaling, reservoir souring, or bacterial contamination of the pipeline. No production chemicals, such as scale inhibitor or corrosion inhibitor, had been used. These factors simplified the failure investigation. Table 3 shows fluid properties.
The corrosion defects were small, discrete pits (5-15 mm in diameter). The shape and size were similar in line pipe and weld regions, and there was no preferential attack of the heat-affected zone.
Viable corrosion mechanisms for unstabilized crude-oil pipelines are:
- Microbially induced corrosion
- Hydrogen sulfide corrosion
- Carbon dioxide corrosion.
Microbially induced corrosion (MIC) was ruled out when bacterial surveys of solids samples taken after maintenance pigging failed to detect bacteria. Also, the worst corrosion damage occurred in sections of the pipeline where fluid velocities approached 10 m/sec; MIC typically appears with low velocity (less than 1 m/sec) or stagnant conditions.
Hydrogen sulfide corrosion was not considered a likely mechanism: H2S is more often associated with cracking than metal-loss corrosion and at a partial pressure of 2.8 x 10⁻⁵ MPa (0.004 psi), H2S cannot generate metal-loss corrosion rates of about 1 mm/year.
The most likely failure mechanism was therefore CO2 corrosion. Although it was impossible to verify this, comparison of the failure rate with established CO2-corrosion-rate prediction models supported the hypothesis.
BP Amoco uses a modified de Waard & Milliams methodology1-4 to predict CO2 corrosion rates. For Wytch Farm conditions, the predicted rate is 1 mm/year, agreeing well with the failure rate (7.8 mm W.T. failed after 7 years' service).
Wytch Farm's produced water is unusual in containing only 40 ppm of bicarbonate (HCO3-), rather than the more typical range of 500-2,500 ppm. This, together with a high concentration of acetate (CH3CO2-) at 100 ppm, resulted in a relatively low pH of 4.5, thereby increasing the CO2 corrosion rate.5
Finally, support for the CO2 hypothesis came from laboratory corrosion tests on separated produced-water samples. Simple bubble tests6 were performed under CO2-saturated conditions, and the corrosion rate observed agreed with that predicted from the failure rate and BP corrosion-rate prediction model.1
Analyses: metallurgy
The intelligent pig inspection report for the 10-in. pipeline reported 281 metal-loss defects. The majority of these were internal metal loss, generally located around the 6 o'clock position on the pipe.
Line pipe corrosion
In total, 246 line pipe features were considered as internal corrosion for the purposes of the work. The maximum reported feature depth was 79% of W.T. (confirmed by excavation and UT measurement), although typical pit depths ranged between 10% and 70% of W.T. Most pits were less than 30 mm long.
Fig. 4 shows the distribution of corrosion features with respect to the distance along the pipeline, circumferential position, and line pipe steel grade.
The distribution of line pipe steel grades appears along the bottom of the chart (with a nominal negative y value), plotted in the order Grade B, X-42, unknown from top to bottom (no records could be found for a small number of pipes/welds).
As shown in Fig. 2, the corrosion-pit frequency increases downstream of Well Site X. This is an area with a high proportion of X-42 pipe, but it is also an area known to have a harsher flow regime than the rest of the pipeline. The effects of flow regime are discussed presently.
After analyses of line pipe corrosion trends quantitatively and with respect to steel grade and location in the pipeline (either upstream [K-X] or downstream [X-GS] of Well Site X), the results are quite clear: X-42 line pipe is more susceptible to corrosion than Grade B line pipe (over both regions); and corrosion is significantly increased downstream of Well Site X (for both steel grades).
There is also a relationship between the defect profile and the steel grade. Tables 4 and 5 present the results of the analyses.
Table 4 shows that the corrosion defects in the upstream and downstream locations (low fluid velocity and high fluid velocity, respectively) are similar for the same grade of line pipe: That is, the mean defect depths, lengths, aspect ratios, and areas are essentially constant for a given grade of steel. It is the frequency of defects that increases significantly in highly turbulent flow.
Aspect ratio is the ratio of defect depth to length: Larger numbers indicate shorter, deeper pits; smaller numbers indicate longer shallower defects.
Table 5 shows similar data to Table 4, expressed as ratios of the performance of X-42 and Grade B and the ratios for upstream and downstream of Well Site X. It shows that X-42 line pipe has three to four times the corrosion frequency of the Grade B pipe, upstream and downstream of Well Site X.
Both steel grades see approximately twice the frequency of corrosion downstream of Well Site X (2.53 for Grade B and 1.83 for X-42). Defect depths are greater in the X-42 line pipe than Grade B at both locations.
X-42 line pipe shows larger aspect ratios (deeper pits) than the Grade B pipe in both sections of the pipeline; note that the overall volume of metal lost to corrosion varies only slightly with steel grade and location.
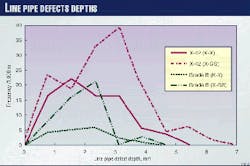
Fig. 5 shows the distributions of line pipe defect depths. The frequency of defect-depth occurrences has been "normalized" to account for the differing quantities of the two line pipe steel grades in the two sections of the pipeline. It can be seen that as the total number of defects increases, so too does the horizontal extent of the distribution.
Given a particular distribution curve "shape" (in this case for defect depths), an increased number of defects will give rise to an increased probability that one (or more) defects of a critical size will be present, increasing the probability of failure.
Weld corrosion
As with the line-pipe corrosion, the frequency and severity of corrosion damage were seen to increase towards the gathering station. Analyses similar to those conducted for the line-pipe features were conducted for the weld defects with respect to the installation contractor responsible for completing the welds (and hence the weld procedure/material) and the grade of parent plate.
As the excavations and NDT examinations only covered about 30% of the welds on the pipeline (193 welds being subject to NDT out of 637 welds reported by the pig inspection), it was necessary to use the pigging vendor's weld-corrosion categories to supplement the non-destructive testing (NDT) results.
The pigging vendor was unable to comment on some of the welds reported by the intelligent pig inspection, such as those at Tee pieces and anchor flanges. There are also several areas on the pipeline where the installation contractor is unknown.
All of these areas are small and located at well sites and were removed from the analysis process. The number of welds analyzed was 585.
Weld performance by installation contractor only. When weld performance was measured with respect to the installation contractors (Table 6), information was gained on:
- The total number of welds performed by each contractor
- The number of "defective welds"
- The mean depth of weld defects attributed to ech contractor
Welds by Contractor A suffer significantly more corrosion (both in terms of depth and the percentage of "defective" welds) than welds by either of the other two installation contractors.
Although this might suggest that welds by Contractor A may be more susceptible to corrosion because of some factor peculiar to his welding process (such as the weld procedure or consumables), there are other, more probable explanations for the different performances. These are discussed in detail presently.
Additionally, the weld consumable used by Contractor A was the same type (C-Mn) as that used by Contractor C whose welds feature substantially lower corrosion susceptibility. This further tends to rule out the installation contractor as a variable in weld-corrosion performance.
Contractor B used a weld consumable containing 1% Ni, but there is insufficient data to determine if this had a significant influence on the good corrosion resistance of those welds.
Weld performance by pipeline location. Flow regime, as discussed later, affects line-pipe corrosion-pit frequency. It is reasonable to assume that the flow regime influence on corrosion rates applies to weld corrosion as well.
It is possible that the effect is compounded at welds because of highly localized turbulence caused by the uneven weld surface. This effect is discussed presently.
Fig. 6 plots weld-defect depths against distance along the pipeline and shows essentially the same information as Fig. 3 but with the weld defects subdivided to show the associated line-pipe steel grade and installation contractor responsible for completing that particular section of the line.
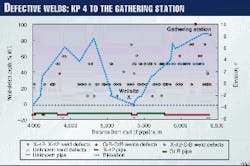
It can be seen that the density of defective welds increases dramatically downstream of KP 4, approximately the location of Well Site D. For clarity, this section of the line is re-plotted in Fig. 7, showing the same data as is shown in Fig. 6, except without the installation contractor information.
Similar analyses to those conducted over the whole pipeline were conducted showing the performance of welds by different installation contractors for the sections of pipeline upstream and downstream of Well Site D. Tables 7 and 8 present the results.
It can be seen that the majority of "defective" welds are downstream of Well Site D and that all the welds in this section of pipeline were completed by Contractor A. Thus, any flow regime effects towards the downstream end of the pipeline will adversely affect the perceived corrosion performance of welds by Contractor A.
Any effects of parent-pipe steel grade on corrosion susceptibility are also likely to influence the corrosion performance of the installation contractors. Since only Contractor A completed welds in X-42 line pipe, the small number of defective welds completed by the other installation contractors invalidates any comparison of defect depths.
Weld performance by parent plate steel grade. Consideration was given to the theory that the corrosion could be driven by galvanic interaction between line pipe of different steel grades. Table 9 presents results of analyses performed to investigate this effect.
These data are for welds completed by Contractor A only, which account for the majority of "defective welds."
There appears to be little difference between the corrosion susceptibility of welds when the parent pipe either side of the weld is of the same steel grade. Where the parent pipe is of different steel grade, the susceptibility appears to be much lower. This may, however, be only an effect of the lower quantity of data.
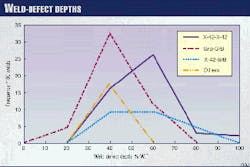
There would also appear to be an increase in the mean corrosion defect depth in X-42-X-42 welds over GrB-GrB welds. Where one of the parent pipes is X-42, the defect depth is also greater than those in GrB-GrB welds, although as noted above this may be an effect of the lower quantity of data.
There appears to be a correlation between the mean depth of the weld defects and the mean depth of features noted in the line-pipe body. The results of the line-pipe data analyses in Table 5 showed that at the downstream end of the pipeline, metal-loss features in X-42 line pipe were 1.54 times deeper than those in Grade B line pipe.
For comparison, the ratio of X-42-X-42 to GrB-GrB weld-defect depths is calculated to be 1.55 from the data in Table 9.
Fig. 8 shows the distribution of weld-defect depths with respect to parent-pipe steel grade for welds completed by Contractor A. In order to show the overall susceptibility to corrosion of welds between each parent-pipe combination, the distribution shows the number of weld defects falling into each depth "band"/100 welds.
The X-42-X-42 welds show a trend towards deeper corrosion defects. The two welds that show 100% W.T. defects comprise the second "in-service" failure and one weld that failed during shot blasting to remove the coating prior to NDT. The first "in-service" failure does not appear in these results for reasons mentioned earlier.
Analyses: flow regime
Flow rate affects corrosion rate, both in single phase and multiphase flow.7 8 Recent work by Ohio University and the Institute for Energy in Norway has indicated strong correlations between corrosion rates and the type of flow regime observed.7 8
In the Ohio work, a modified Froude number is related to corrosion rates, and this approach is adopted here. (Equation 1 provides a definition of the Froude number, presently.)
Nature of Froude number. The Froude number is a measure of the turbulence induced into the film in front of a slug. Corrosion is enhanced as the boundary layer is thinned or destroyed by increasing slug velocity or decreasing liquid film thickness.
It follows that the Froude number is higher going up hill than it is downhill for similar flow rates of oil, water, and gas because the film is thinner uphill. (Liquid hold-up is reduced as a result of gravity.) The Froude number analysis is based on idealized pipelines: smooth, constant-diameter pipes with no intrusions.
The effects of disruptions to flow path on the turbulence at the front of a slug are not well understood. Unpublished work based on mass-transport experiments and computational fluid dynamics has shown local shearing effects to be double or greater the shear seen in normal flow.
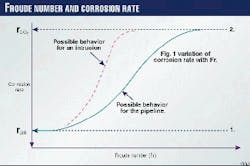
Fig. 9 shows a possible effect of an intrusion (such as a weld root) on the corrosion rate and its possible relationship to the Froude number. It should be noted that the shapes of the curves are only approximate and not based on highly detailed analysis.
The rate of corrosion is shown on the Y-axis of the trend chart and demonstrates the two extremes of corrosion.
Diffusion-rate controlled corrosion. Line 1 in Fig. 9: The rate of diffusion is controlling the corrosion rate. Rate of reaction is rdiff. The reaction is limited by the mass transfer to or from the surface: That is, the rate of diffusion through the lamina sublayer and buffer zone is slow in comparison to the reaction rate at the surface.
Reaction rate controlled corrosion. Line 2 in Fig. 9: The rate of reaction is controlling the corrosion rate. Rate of reaction is rCO2; that is, the turbulence generated by the flow completely removes the diffusion effect that would otherwise limit the reaction rate.
Most field conditions will be between the two extremes where the boundary layer plays a role in determining the corrosion rate.4
Recent work has attempted to define the level of turbulence required to cause a significant shift in the corrosion rate, from that being dominated by diffusion control to a much higher rate, dominated by reaction kinetics. The Froude number range of 5-8 was defined for CO2 corrosion under multiphase slug flow.7
This assumes that there will be free water available to wet the pipewall and cause corrosion. This work used the procedure of Karabelas9 to establish if water is in a free state.
Froude number calculation
This calculation is based on work in multiphase flow and ultimately yields a modified Froude number (Fr), proposed by Jepson:5 (See Equations)
HL = The hold up on average in a section of pipe and can be obtained from Taitel Dukler's method10 of interfacial friction balancing where:HLS = The hold up in a slug (obtained from a suitable correlation)
VM = The mixture velocity
VSL = The superficial gas velocity.
The slug and bubble lengths (LS and LB) can be found from a mass balance, once the slug frequency has been calculated with an appropriate correlation.
A closure relationship is required to link HF and VF. (Notice that any pair of these numbers can satisfy Equation 5.) There are several methods available to provide this relationship. The Crowley11 method is recommended to calculate the hold up in the film.
Application
To quantify the influence of flow on the observed distribution and severity of corrosion in the Wytch Farm pipeline, production data for the previous 2½ years were taken and predictions of nodal pressures were calculated from a matched multiphase flow spreadsheet which provided physical properties at each point.
Each node is one of the topographical points shown in Fig. 1, where a change in inclination takes place.
The presence of free water in large parts of the pipeline is known from the observed corrosion damage, but checks were performed, with the method of Karabelas. This confirmed that a free layer of water is predicted along the length of the pipeline.
The Froude number was calculated for the pipeline to determine if it could explain the pattern of corrosion damage observed.
The general approach described previously was applied with the following simplifications and closure relationships:
- A slug shedding factor of 1.25 was used, i.e., k=1.25 with C=0
- HLS was calculated using Gregory12
- Inclination was ignored because of the varied results obtained in Slug Frequency calculations. Hill was used to describe horizontal slugs.13
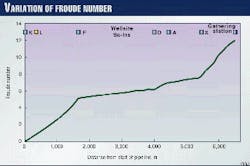
The approach of Crowley was used to calculate HF and Taitel Dukler was used to obtain the equivalent stratified layer hold up. Fig. 10 shows the variation of Froude number with distance along the pipeline for a sample month, in this case January 1997. As Fig. 10 shows, there is a sudden increase in Froude number beyond the last tie-in point, Well Site X. As the velocity increases (driven by the gas expansion), the slugs accelerate, which in turn increases the overall pressure drop further.
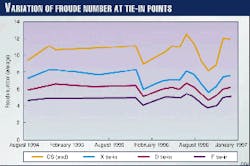
If all the historical data are put through the same process and the Froude number at each tie in point is considered, then Fig. 11 is obtained. This figure shows that the flow regime at each tie-in point has been approximately constant.
From multiphase flow modeling, the predominant flow regime is slug flow in the horizontal and uphill sections. As the Froude number is a measure of turbulence at the front of a slug, Froude number can be used as a measure of the turbulence in these sections.
It can be seen that the majority of the pipeline (from KP 1.8 to the end) is operating at Froude numbers greater than 5, but only the final section (corresponding approximately to the X-site tie-in or KP 5.3) is operating at a Froude number greater than 8.
From the observations made regarding the frequency of corrosion defects in the line pipe, it appears that Froude numbers greater than 8 are required to increase the frequency of corrosion defects on a smooth pipe.
The observations made regarding girth welds showed that the frequency and rate of corrosion at welds increased further upstream than did the line-pipe corrosion frequency (corresponding to Well Site D, or KP 4.0). From this, it can be postulated that the localized turbulence at a weld root is equivalent to an overall increase in Froude numbers of 2 or 3 greater than that predicted for smooth pipe.
References
- McMahon, A.J., and Paisley, D.M.E., "Corrosion Prediction Modeling," BP Guidelines, Report number ESR.96.ER.066, November 1996.
- de Waard, C., Lotz, U., and Milliams, D.E., "Predictive model for CO2 corrosion engineering in wet natural gas pipelines," Corrosion, 47 (1991) 976.
- de Waard, C., and Lotz, U., "Prediction of CO2 corrosion of carbon steel," NACE Corrosion 93, New Orleans, Paper No. 69.
- de Waard, C., Lotz, U., and Dugstad, A., "Influence of liquid flow velocity on CO2 corrosion: A semi-empirical model," NACE Corrosion 95, Orlando, Paper No. 128.
- Hedges, B., and McVeigh, L., "The role of acetate in CO2 corrosion: the double whammy," NACE, Corrosion 99.
- Webster, S., McMahon, A.J., Paisley, D.M.E., and Harrop, D., "Corrosion inhibitor test methods", BP Guidelines, Report number ESR.95.ER.054, November 1996.
- Jepson, P., et al., National Science Foundation Industry/University Co-operative Research Centre for Corrosion in Multiphase Systems, Ohio University.
- Nesic, S., Langsholt, M., Lunde, K., Nordsveen, M., Thomassen, D., "The Effect of Multiphase Flow on CO2 Corrosion and its Inhibition: Phase I-Measurements of Wall Shear Stress and Mass Transfer in Two-Phase Gas/Liquid Flow" IFE/KR/F-95/205. Unpublished work by IFE for BP Amoco, and Statoil.
- Karabelas, A.J., Vertical Distribution of Dilute Suspensions in Turbulent Pipe Flow, AIChemE Journal (Vol. 23, No. 4), July 1977.
- Taitel, Y., and Dukler, A.E., A Model for Predicting Flow Regime Transitions in Horizontal and Near Horizontal Gas-Liquid Flow AIChE Journal, Vol 22 (1976), pp. 47-55.
- Crowley, C.J., and Rothe, P.H., State of the Art Report on Multiphase Methods for Gas and Oil Pipelines volume 2 Guide to Computerized Calculations, Creare Inc. report TN-409, Vol. 2, 1986 (prepared for Project PR-172-609, American Gas Association, Catalog No. L51527).
- Gregory, G.A., Nicholson, M.K., and Aziz, K., Correlation of Liquid Volume Fraction in the Slug for Horizontal Gas-Liquid Slug Flow Int J Multiphase Flow, Vol. 4 (1978), pp. 33-39
- Hill, T.J., and Wood, D.G., "Slug Flow: Occurrence, Consequences and Prediction," paper SPE 27960 presented at the University of Tulsa Centennial Petroleum Engineering Symposium, Aug. 29-31, 1994.
The Authors
Since 1998, Dominic Paisley has worked for BP Exploration (Alaska) as a corrosion engineer on the Prudhoe Bay field. He joined BP in 1989 and worked on materials and corrosion matters at the central technology center in Sunbury, U.K., until 1996.
In 1996, he moved to Wytch Farm, BP Amoco's oil field on England's south coast, as a corrosion engineer. Paisley received a BS (honors, first class) in materials science and technology from Brunel University, West London, in 1989. He is a chartered engineer, a European Engineer, and a Professional Member of the Institute of Materials.
Nathan Barrett has, since 1998, worked at BP Amoco's Wytch Farm oil field as a process engineer. After graduating from Bath University, U.K., in 1996 with first class honors as a bachelor of chemical engineering, he joined BP Exploration at its group research center in Sunbury. He is currently a graduate member of both the SPE and IChemE.
Owen Wilson is a senior engineer with Andrew Palmer & Associates, Aberdeen. Since joining the company in 1996, he has mainly been involved in providing support to BP Amoco in pipeline operations both on and offshore, principally in the areas of defect investigation and pipeline integrity management. He received a BEng (honors, first class) degree in civil and structural engineering in 1996 from the University of Aberdeen.
