Deviation log, new formulae aid directional drillers
New formulae that mathematically define technical hole deviation, aided by hole deviation logs, provide directional drillers with new methods for rationalizing tool settings.
The eight components that collectively define directional-drilling relationships are presented in the format of two separate well logs.
A method is detailed for finding the minimum distance between a survey station and the planned path, and the corresponding planned measured depth. Additionally, a new type of well design, which is entirely practical, given the advent of rotary-steerable directional drilling tools, is introduced to address transitions between linear and curved hole sections.
Importance
Technical hole deviation describes geometric differences between actual and planned drill paths. A fundamental factor that affects deviation control response is the interpretation of hole deviation.
Traditionally, as the hole is drilled, a directional driller mentally interprets hole deviation from survey data and directional plots, and intermittently concludes deviation control response by altering tool settings or drilling mode.
A quantitative description of hole deviation is useful for three primary reasons. First, by providing the directional driller with a hole deviation log in real-time, it is possible to improve deviation control performance by influencing the driller`s control response. This is especially important when drilling 3D well paths where the mental inference of hole deviation is often complicated.
Second, automated directional drilling systems require numeric values to determine control output such as tool settings. That is, an automated system has a controller. The controller-implemented as software in a computer chip-is essentially the brains of the system. Through control rules, the controller computes tool-setting adjustments from system inputs. Obvious inputs are metrics that adequately address hole deviation.
Third, technical hole deviation contains much more information about directional drilling performance than what is conveyed through directional vertical section and plan view plots.
A hole-deviation log succinctly conveys the well plan and hole deviation. It equips the operator with a superior mechanism for monitoring directional control as a well is drilled. It also provides the foundation from which to compare overall directional control performance across multiple wells and service companies.
A hole deviation log can be generated as each new survey station is acquired, or at any time thereafter.
Plan, mathematically defined
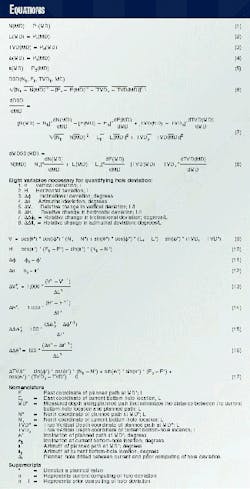
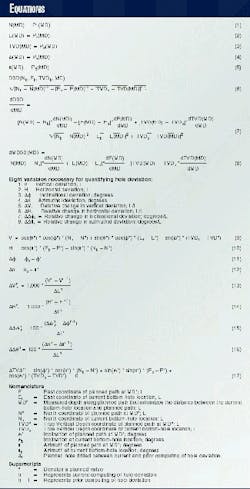
Respective to hole deviation, a preferred method for mathematically representing the entire planned drill path is to parametrically define each Cartesian coordinate, hole inclination, and azimuth, in terms of measured depth (MD). That is, the planned path is designed and then mathematically represented as shown in Equations 1-5 (see Equation Box).
N, E, and TVD represent earth-fixed Cartesian coordinates North, East, and True Vertical Depth, respectively, and Pi are applicable functions dependent on the well path design. The phi and theta represent planned hole inclination and azimuth, respectively. MD ranges from zero to planned total depth.
Minimum distance
As the hole is drilled, it is necessary to determine where on the plan one prefers the well bore to exist. The linear distance between the current bottom-hole location (Nb, Eb, TVDb) and a point on the planned path is computed with the 3D distance formula. This is generally represented by Equation 6.
Let MD* represent the measured depth along the planned path, whose respective Cartesian coordinates (N*, E*, TVD*) = (P1(MD*), P2(MD*), P3(MD*)) minimize the distance computed with Equation 6. MD* is found by solving the equation derived by taking the derivative of Equation 6 with respect to MD and setting the result equal to zero.
Thus, parametric functions, which define the derivatives of the planned earth-fixed Cartesian coordinates, are also needed. Equation 7 is the derivative of Equation 6 with constants omitted.
The measured depth that sets the right-hand side of Equation 7 equal to zero is MD*. The numerator of the right-hand side of Equation 7 makes the only relevant contribution to finding the practical root. Therefore, the denominator may be ignored, and MD* is found by solving Equation 8.
For practical purposes, Equation 8 is a Piecewise-continuous, monotonically increasing function. Thus, finding MD* with Equation 8 is a simple numerical task, and a logical initial guess is a value less than the current TD.
Pi and dPi/dMD are Piecewise-continuous functions. The functional form of each Pi component depends on whether the respective interval is linear or curved. Component functions of Pi for a 3D circular hole section such as a simultaneous build and right turn may be derived from any general 3D circular-arc well planning method that includes interpolation formulae.1
Minimum-curvature survey calculation methods that include interpolation formulae may also be employed to determine component functions of Pi for 3D circular hole sections;2 either route leads to identical numeric solutions. The component functions of Pi for a linear hole section are determined with the cosines of the line.
Planned drill paths comprised of linear and circular hole sections can always be defined as generally presented (Equations 1-5), and their derivatives determined symbolically. When MD* has been found, the task of computing the associated coordinates and angles is straightforward with Equations 1-5.
Deviation, mathematically defined
As stated, technical hole deviation describes the geometric discrepancies between actual and planned drill paths. Hole deviation is a matter of definition, as opposed to derivation. The following definition of hole deviation originated from work performed by the author in which a Fuzzy Logic control algorithm was developed for rotary-steerable directional drilling.
While the foregoing, patent-pending control methodology is specific to directional drilling tools that can selectively affect the direction and magnitude of lateral forces acting at the drill-bit, the input (i.e., hole deviation) is informative for any type of directional drilling.
Eight variables are necessary to sufficiently quantify hole deviation. These are listed in the Equation Box and mathematically defined in Equations 9-16.
The superscript "n" in the definitions of each "relative change in ellipse" refers to the respective values during the current computing of hole deviation. Additionally, "n-1" refers to values from the prior computation.
The term deltaL refers to the length of planned hole drilled between the two foregoing hole-deviation computations. Thus, deltaL is MD*(n) - MD*(n-1). deltaL is preferably somewhat short; for example, 10 to 90 ft (3 to 27 m). The constants (1,000 and 100) are included solely for convenience when plotting.
Fundamentals
Hole deviation is defined with properties of the nearest point on the planned path (i.e., at MD*). Vertical and horizontal deviations are lineal differences, whereas inclinational and azimuthal deviations are angular differences.
These first-order differences represent current states. The relative changes in vertical, horizontal, inclinational, and azimuthal deviations are second-order differences that measure how the respective state is changing as the hole is drilled.
1st order [V } lineal {H][delta phi} angular {delta theta]
2nd order [deltaVr } lineal {deltaHr] [delta delta phir} angular {delta delta thetar]
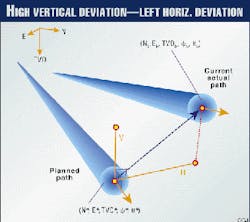
Vertical (V) and horizontal (H) deviations may be viewed in the mind`s eye as looking down the planned hole from MD* in an orientation parallel to a line defined by phi* and theta*, and seeing the current hole bottom in the periphery. From this viewpoint, +V points to the high side of the imaginary hole while +H points to the right.
V and H are components of a vector, which points from (N*, E*, TVD*) to (Nb, Eb, TVDb). The components V and H are portrayed in Fig. 1. Performing two successive coordinate axis rotations will derive the equations for V and H.
The first rotation is by theta* about the TVD axis. The second rotation is by phi* about the E` axis. By definition, the aforementioned vector is orthogonal to the planned path at MD*. As such, a numerical check to ensure MD* found with Equation 8 is correct comes by verifying that TVD" equals zero, as shown in Equation 17.
Inclinational (delta phi) and azimuthal (delta theta) deviations are more difficult to visualize than V and H. delta phi and delta theta are differences in well bore angles. The relative changes in vertical (deltaVr), horizontal (deltaHr), inclinational (delta delta phir), and azimuthal (delta delta thetar) deviations are far less intuitive than are V, H, delta phi, and delta theta; however, they are extremely informative.
An analogous example to convey their importance might be the significance of determining a car`s position and velocity before deciding whether to cross a street. Only when all eight hole-deviation components equal zero does an actual drill path perfectly follow a planned drilling trajectory over deltaL.
V and H are lengths (ft, m), delta phi and delta theta are angles (°), and deltaVr and deltaHr are dimensionless numbers. While delta delta phir and delta delta thetar have units similar to dogleg-severity (DLS), they are not measurement of well bore curvature. Indeed, borehole DLS could equal 4°/100 ft while delta delta phir could be nil and vice versa.
Most often, simultaneous interpretation of eight variables is not a simple task. Fortunately, it is possible and logical to segregate hole deviation into its vertical and horizontal constituents. This observation transforms the number of variables to interpret into two groups of four. "Vertical" constituents include V, delta phi, deltaVr, and delta delta phir; "horizontal" constituents include H, delta theta, deltaHr, and delta delta thetar.
Deviation log, China
Table 1 presents the critical points of a directional sidetrack drilled in China. Measured depths and coordinates are stated relative to a window that was cut at 5,050 ft MD. As Table 1 shows, the directional plan, beginning with an inclination and azimuth of 56.2 and 84.3?, respectively, was to drop inclination while turning right to an azimuth of 203?.
A tangent section was incorporated in the design to connect the preceding 3?/100 ft drop and right-turn hole section to a 6?/100 ft build and left-turn hole section. That is, after holding angle for about 2,300 ft, the plan was to build hole inclination while turning back left, intending to hit the target horizontally and due south.
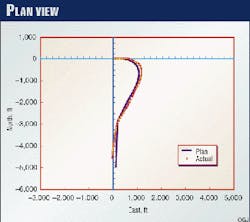
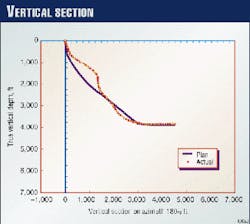
Standard plan and vertical section views are presented in Figs. 2 (above) and 3 (at right), respectively. Directional drilling was conducted with a bent-housing mud motor. The computations of hole deviation were not available when the well was drilled.
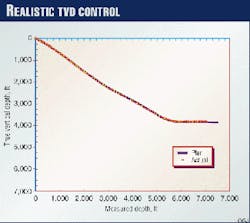
Less-typical plots are presented in Figs. 4-6. The graph of TVD versus MD* (Fig. 4, at right) portrays better and more realistic TVD control than does the vertical section view (Fig. 3). While Figs. 5 and 6 (below)are informative and self-explanatory to the trained reader, a more efficient means is needed to collectively convey the geometric aspects of directional performance; hence, the hole deviation log.
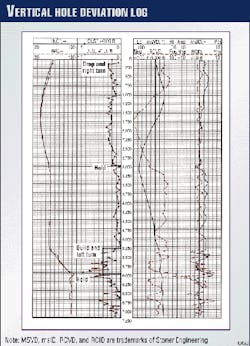
A hole deviation log should concisely display the directional well plan and deviations from the directional well plan. Accordingly, consider the hole deviation logs presented in Figs. 7 and 8 for the example well. All values are plotted vs. MD. An asterisk denotes a planned value. (Fig. 5 at right)
Fig. 7 is a "vertical" hole deviation log. Four tracks are displayed. The outer left track graphs planned and actual well-bore inclination. Planned and actual DLSs are graphed on the inner left track. The circular unfilled markers on the actual DLS curve are present to convey depths with survey stations. The circular filled markers on the planned DLS curve convey critical-point changes in the well plan (e.g., curved to straight). (Fig. 6 at right)
Hole deviation in the vertical sense is displayed on the two right tracks of Fig. 7 (at right). The inner right track displays vertical deviation (msVD, same as V) and the relative change in vertical deviation (RCVD, same as deltaVr). The outer right track displays inclinational deviation (msID, same as delta phi) and the relative change in inclinational deviation (RCID, same as delta delta phir).
Zero centers each of the two right tracks. As previously stated, for the actual drill path to follow the planned path in the vertical sense, msVD, RCVD, msID, and RCID must trace their respective zero lines.
Fig. 8 (at right) is a "horizontal" hole deviation log. Four tracks are displayed. The outer left track graphs planned and actual well bore azimuth. Again, planned and actual DLS is graphed on the inner left track. Hole deviation in the horizontal sense is displayed on the two right tracks of Fig. 7.
The inner right track displays horizontal deviation (msHD, same as H) and the relative change in horizontal deviation (RCHD, same as Hr). The outer right track displays azimuthal deviation (msAD, same as ) and the relative change in azimuthal deviation (RCAD, same as r).
Zero centers each of the two right tracks. For the actual drill path to follow the planned path in the horizontal sense, msHD, RCHD, msAD, and RCAD must trace their respective zero lines. Numerical values of hole deviation for the example well are provided in Table 2.
A foundation of directional control
Let us wind-back the clock and imagine the bit drilling new hole at a depth of 1,000 ft MD for the example well. The vertical hole deviation log shows the well bore is 40 ft high (msVD = 40) of the plan. Hole inclination is a little high but steadily approaching the plan (msID positive, RCID slightly negative).
The relative change in vertical deviation is zero, but quickly heading negative (RCVD 0fineg). Thus, it is likely that the hole will soon head back towards the plan. The tangent section does not begin for another 2,000 ft. What should be done in this case? How should directional tool settings be altered, if at all?
Inference of hole deviation, however it is defined, when combined with expectancy of system response in relation to the remaining planned path, dictates the directional control actions made while drilling. For this reason, a set of rules may be compiled and employed to map hole deviation into a directional control action to pursue the planned trajectory.
In other words, it is possible for a directional driller (or algorithm) to process and interpret values contained in the hole deviation log and then determine the next adjustment to a directional tool to achieve the intended result. The details, which defend the foregoing statements, await further publication.
The task of a directional driller, or that of an auotmated drilling control system, requires "tuning" in eight dimensions. This observation helps to explain the complexity of directional-drilling trajectory control. Because directional drillers are humans, directional performance can easily vary for a variety of reasons. Steps toward automated or partially automated control systems should alleviate performance variability.
The directional control performance of an automated directional drilling system, or that of a directional driller, depends on input, and the result of actions taken after mapping input into output. Thus, quantifying meaningful input such as technical hole deviation has significant value for either case.
Future well paths
Planned directional drill paths are comprised of a finite number of connecting linear and curved hole sections. The most common curved section follows a circular segment. At least one other curved drilling trajectory exists-the catenary method.3
As new downhole-adjustable directional drilling tools become available to industry,4 planned non-linear drill paths will expand beyond constant-curvature or circular hole sections. When considering the importance of smooth boreholes, especially in extended-reach drilling applications, it is advantageous for the planned hole-inclination and hole-azimuth profiles to be smooth or continuously differentiable with respect to MD.
In other words, planned DLSs should gradually change across hole-section transitions. Drilling a circular hole section in sequence with a linear hole section-the current industry standard-creates an abrupt change in DLS near the transition.
A planned hole-inclination profile for a 2D horizontal well is presented in Fig. 9. For the traditional case comprising a constant build gradient, the kick-off point is K1, and horizontal is reached at the MD associated with H.
As Lubinski stated in the 1960s,5 DLS measures the change in overall angle of the well bore. Thus, overall well-bore angle (inclination in this case) does not change after H, the dogleg at H is classified as smooth, or not abrupt.
It is true, however, that an abrupt change in DLS exists at K1 and at H for the traditional case. For example, consider a planned build gradient of 3°/100 ft. The plan reflects that at H, the well-bore curvature should instantaneously change from 3°/100 ft to 0°/100 ft-an unrealistic feat for long and medium-radii directional wells.
For the non-traditional case of employing a variable build gradient with target constraints held constant, the kick-off point exists at K2, which is more shallow than K1. With the construct presented in Fig. 9, the change in DLS is gradual between the linear and curved hole sections.
That is, the acceleration or change in the change of overall angle is gradual. The drill path between A and B is of the same circular shape as that between K1 and H. The drill path between K2 and A, for example, could follow a cubic equation.
An implication of this well design is a more-controllable trajectory at hole-section transitions. This is because the inherent follow-through characteristics of a bottom-hole assembly, associated with a change in build gradient, would be lessened.
For example, observe a typical inclination overshoot at about 6,000 ft MD in Fig. 7. Transients of this nature cause excessive DLS, and thus burden hole quality for the remaining life of the well.
Another likely result is less overall torque-and-drag while drilling anywhere below K2. Rotary-steerable drilling tools are well suited to the proposed type of well design because the direction and magnitude of bit forces can be altered with downhole tool-setting adjustments.
Acknowledgment
The author wishes to thank Max Lund, a senior directional drilling supervisor of Baker Hughes Inteq, for providing the directional survey data.
References
- Ebrahim, A., General three-dimensional well trajectory planning for single or multiple targets directional well, Petroleum Engineering MS Thesis T-4708, Colorado School of Mines, Golden, Colo., 1995.
- Long, R.C., and Mitchell, B.J., "A new approach to directional survey interpretation and course correction by the sectional method," Journal of Energy Resources Technology, June 1992, pp. 163-74.
- McClendon, R.T., and Anders, E.O., "Directional drilling using the catenary method," SPE/IADC article 13478, presented at SPE/IADC Drilling Conference, New Orleans, Mar. 6-8, 1985.
- Poli, S., Donati, F., Oppelt, J., and Ragnitz, D., "Advanced tools for advanced wells: rotary closed-loop drilling system-results of prototype field testing," SPE paper 36884, June 1998, pp. 67-72.
- Lubinski, A., "Maximum permissible dog-legs in rotary boreholes," Journal of Petroleum Technology, February 1961, pp. 175-94.
The Author
Michael S. Stoner is an in-house consulting petroleum engineer and computer programmer for Questa Engineering Corp. in Golden, Colo. He holds a BS and PhD in petroleum engineering from the Colorado School of Mines (1994, 1997). Previous experience includes work in production for Oryx Energy Co., and in drilling for Texaco E&P Co., Anadarko Petroleum Corp., and CSM`s Drilling Engineering Research Group.
Stoner prepared the technical text for Gas Research Institute`s web-based underbalanced drilling tutorial, and is the inventor of a patent-pending fuzzy controller for automated directional drilling.
