Risk-based methods optimize maintenance work scope
The application of risk-based prioritization for scheduling maintenance and turnaround activities can yield significant economic advantages.
Reliable data and a commitment to a risk-based strategy could reduce downtime days by 10% and execution costs by 15%.
The implementation of a risk-based inspection (RBI) strategy was applied at two plants with the help of Aptech Engineering Services Corp.: one at Tennessee Eastman Division (TED) of Eastman Chemical Co., Kingsport, Tenn., and the other at Tesoro Hawaii Corp.`s Kapolei, Ha., refinery. Information obtained from the risk-based methodology was used to enhance safety, performance, and management of the turnarounds.
Although not used in these two processing plants, the use of template planning with risk ranking can further optimize the work scope.
Risk-based strategies
The value of risk strategies can only be discerned as the company begins to use these tools on an everyday basis. The approach is a means of starting the process, and the application is continually improved as more historical plant data are obtained and documented.
Risk-based strategies are also referred to as evidence-based. The method is evergreen. As evidence is gained, it provides additional knowledge of the suitability for service of an equipment item. The owner continually refines his knowledge of the risk associated with keeping that equipment in service.
In this approach, the owner creates a relative risk ranking, which is benchmarked to industry experience and used for inspection planning. If the risk is not sufficiently quantified so that it can be managed, additional evidence is obtained on the equipment item until it is either replaced or the understanding of its risk of operation is acceptable.
If initial semiquantitative evaluation yields unacceptable results and upon development of subsequent additional evidence (that is, inspection, operations, or, other test data), risk is still unacceptable, a fully quantitative consequence analysis may be appropriate.
Quantitative analyses address specific degradation, such as hydrogen cracking or stress-corrosion cracking. In these cases, deterministic or probabilistic fitness for service methodologies may apply.
Definition of risk
Three basic questions establish the basis for defining risk:
- What could go wrong (scenario or event)?
- How often might it happen (likelihood)?
- What are the consequences (consequences)?
Risk, in its most simple form, may be characterized as the product of probability of a given failure event (likelihood of failure) and the consequences of that event (consequences of failure).
The consequences can be expressed in terms of the physical damages, production delays or shortfalls, casualties, or the monetary equivalents of these items. A high-risk activity typically either has a high probability of occurring (with limited consequences) or a low probability of occurring with significant consequences.
The leakage of a valve seal is an example of high-probability/low-consequence events. The rupture of a pipeline or pressure vessel resulting in an explosion and fire would be defined as a low-probability/high-consequence event.
High-probability/low-consequence events, if they become common, can a have high impact on economic risk, especially if such events increase the probability of otherwise low-probability major events. For example, a plant that frequently needs unscheduled maintenance is at a greater risk of costly delays or losses than one that has an effective preventive maintenance program and infrequent unscheduled maintenance needs.
Application
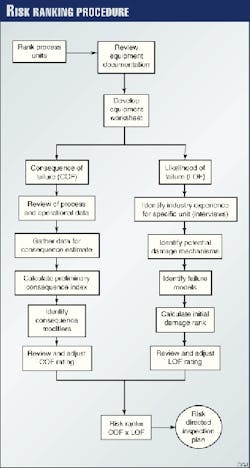
Fig. 1 depicts the steps to applying risk-ranking techniques. It begins with a document review, which defines the quality of the documentation available and the information needed to develop checklists and worksheets. These worksheets include
- Equipment data checklists
- Process data checklists
- Location/hazard operability study (Hazop) information checklists
- Environmental information checklists
- Likelihood of failure worksheets
- Consequence of failure worksheets.
The risk ranking for each piece of equipment is individually assessed using the available evidence.
Estimating the consequence-of-failure value is done by considering a series of attributes. These attributes include the operating or design pressure and temperature, the quantity of contained fluid, Material Safety Data Sheets (MSDS), and the properties of nonprocess hazards (such as steam and caustics).
These factors are used to develop a preliminary consequence index (PCI), which is then modified by considering Hazop results, equipment location, personnel access, and operating conditions. Four common categories for consequence-of-failure ranking are
- Considerable
- Serious
- Some
- Minor or no impact to personnel.
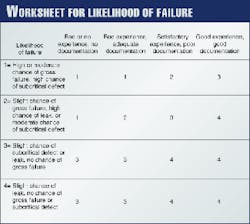
In estimating the likelihood-of-failure value, the owner first identifies the potential damage mechanisms (the damage scenarios) and then determines the potential modes of failure that might result from these mechanisms. A damage rank is then assigned based on the probability of occurrence and the failure mode if the hazard goes undetected.Estimation of the likelihood-of-failure value also takes into account the following factors:
- Quality of available documentation
- Hazop results
- Planned changes
- Transients and off-normal operations
- Materials of construction
- Equipment history
- Process streams and contaminants composition.
A typical worksheet for the final likelihood estimation is shown in Fig. 2.
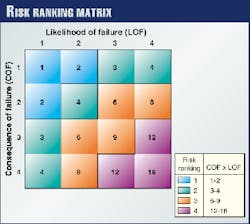
Once both consequence-of-failure and likelihood-of-failure branches of the process are completed, the product of the consequence-of-failure and the likelihood-of-failure values is determined. This value establishes the risk ranking for the equipment item. A risk matrix (Fig. 3) is used to define inspection requirements and intervals.
Table 1 shows how inspection intervals generally can be set based on this method of risk prioritization.
Chemical plant results
TED implemented a pilot project to implement risk-based methodology.
The scope of the initial piece of the pilot project included four process units-more than 400 vessels. The process units assessed were
- An acid-production unit
- An intermediate production unit
- A solvent-production unit
- An acetate-production unit.
These units were representative of the vessels in the plant and the potential failure modes that could be expected.
Less than 5% of the vessels assessed in the pilot project had an overall risk ranking of two or less. Of the more than 60 potential damage mechanisms included in the model, 20 were identified as present in the pilot processes and four were dominant. The dominant mechanisms were:
- Pitting, uniform, and crevice corrosion
- Organic acid corrosion
- Halide stress-corrosion cracking
- Erosion.
A review of the RBI implementation in the acetate-production unit illustrates how the company wisely accessed the scope of work there. The unit has 25 vessels. Of these 25, prior to the risk-based assessment, 20 internal inspections were planned.
After the assessment, it was determined that a total of nine vessels should be inspected internally and that this might be reduced to three vessels after the first inspection cycle. The remaining vessels could be placed on a longer than 2-year inspection cycle supplemented with an ultrasonic thickness (UT) monitoring program.
After the first inspection cycle was completed and the inspection expectations verified, it was actually determined that eight vessels required an internal inspection. One vessel, with an overall risk ranking of two or less, remained on a 2-year cycle. Seven vessels, with an overall risk ranking of three or more, were considered for longer inspection cycles (between 2 and 8 years).
The remaining 17 vessels, with overall risk rankings of three or more, were considered for up to the maximum interval of 10 years.
In the past, TED has had a 2-year state inspection interval on 3,800 vessels requiring internal inspection and registered with the state.1
These risk-based assessment results were presented to the Tennessee Board of Boiler Rules in 1997, and a request was made for exemption to the current 2-year requirement for internal inspection of vessels.
The Tennessee Board of Boiler Rules tentatively granted this exemption with the agreement that additional pilot data would be obtained and a follow-up presentation would be made this year. Also, TED must continue to apply this risk-based methodology and comply with the inspection guidelines shown in Table 1. These additional pilot efforts are currently underway.1
Refinery results
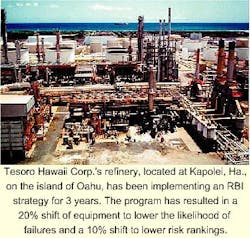
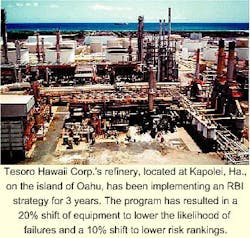
The Tesoro Hawaii refinery is a 95,000 b/d refinery located on the island of Oahu. The plant has been implementing an RBI philosophy for 3 years. During this time, it has amassed significant evidence in a focused manner concerning the service suitability of certain equipment.
All of the approximately 600 vessels in 14 process units were evaluated in the refinery. A team of engineers, inspectors, and metallurgists from both Tesoro and Aptech determined the consequence of failure and likelihood of failure for each equipment. The team then developed a risk matrix to provide the basis for each equipment item`s risk ranking.
An increase in the risk ranking number results in a decrease in the inspection frequency. The equipment with the highest risk (low risk ranking number) has the frequency established on an individual basis considering all aspects of the risk involved, with a maximum of 3 years. For equipment falling in other regions of the matrix, the frequency is based on the unit turnaround intervals. For example risk ranking numbers of 2, 3, and 4 were matched with turnaround intervals of 6, 9, and 10 years, respectively.
A thickness-monitoring database and the Equipment Information Database (EID) are used to ensure that the inspection interval does not exceed one-half of the estimated remaining life without appropriate engineering justification and documentation.
The scope of inspection is established in a similar manner. The higher the risk ranking, the more surface area and/or the number of different locations were to be inspected. For example, risk ranking numbers of 1, 2, 3, and 4 were matched with surface areas of 100%, 50%, 25%, and 10%, respectively.
The EID database manages and integrates the risk ranking, equipment data, inspection results, and thickness data into inspection plans, reports, and schedules.
The risk-based effort has resulted in an inspection and maintenance program with improved performance and reliability at a lower cost and lower documented risk.
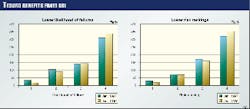
In 2 years, the program has resulted in a 20% shift to a lower likelihood of failure. That is, equipment that accounted for likelihood-of-failure values of 1 and 2 (higher likelihood of occurrence) have shifted to likelihood of failure values of 3 and 4 (lower likelihood of occurrence). Similarly, 10% of the equipment with values of 1 and 2 (high risk) have moved to Values 3 and 4 (Fig. 4).
The planning and inspection efforts resulted in a total refinery turnaround being completed on time and within budget. Future turnarounds are expected to be 25% lower in cost than historical averages as a result of focused inspection plans and elimination of the over-inspection of equipment.
Today`s turnaround planning
Most of today`s turnarounds spend more than budgeted and do not meet milestone completion dates. The reasons for the poor performance are complex, but the root of most problems is the basis upon which scope of work is established.
Today`s turnaround scope of work is a grouping of work lists that is typically generated by several sources: operations, inspection, maintenance, instrumentation, electrical, mechanical, and engineering personnel as well as capital projects.
These lists are combined into a scope of work and measured against a budget and schedule target. Several iterations of review, priority, cost, and other issues are conducted in the guise of turnaround management.
The factors employed to settle the final scope of work are too numerous to detail but there is far too little, if any, regard to total plant reliability for the targeted run cycle.
What is wrong with the current way of doing business? First, the basis of estimating labor units to work is primarily an "experience unit" established by the planners. A typical turnaround work order is "open, clean, and inspect" for repairs. Creating a critical path schedule with this type of work request has rearranged several planning careers.
The "open, clean, and inspect" itself is not the main culprit, the culprit is the guess in lieu of an engineering estimate.
The negative properties of this single logic estimate are that the estimate is primarily experienced-based, history-based, and does not account for surprises.
Another negative factor in today`s typical refinery turnaround is the high turnover rate of the management team. With units running 3-5 years between turnarounds, many turnaround managers may not see more than a single experience. The high turnover rate reduces valuable experience. The execution team, on the other hand, is normally more stable.
RBI turnaround planning
The fundamentals of risk-based inspection lend themselves to turnaround scope optimization. The critical equipment identified in RBI becomes the first level of work scope development.
The second level of work scope development is putting these items into a mechanical plan. Template planning allows owners to create a mechanical plan in an educated and structured manner, without guessing at timing and costs. It relies on a database of items such as cost, duration, and schedule for similar equipment to create a turnaround schedule.
Template planning relies on two principles:
- The equipment`s physical attributes require specific labor units.
- The equipment`s condition determines the combinations of labor units needed to restore reliable operation.
Template planning for turnaround scope of work uses a process called MEMO. MEMO stands for:
- Modes of maintenance (scheduled or unscheduled)
- Elements of maintenance (planning, inspection, scheduling, predictive maintenance, preventive maintenance, material management)
- Modifiers (skill of crafts, number of crafts, operation of equipment, quality of materials)
- Optimizers (risk ranking, life cycle analysis, process simulation, template planning, technologies).
Estimated labor units used in template planning are from a library of tables that have been created from 20 years of labor sampling on the U.S. Gulf Coast. This library is referred to as the Gulf Coast Benchmark. The application of template planning outside the Gulf Coast is modified via a productive factor.
Template planning requires that equipment data be set up in a hierarchy as follows:
- Equipment serial class
- Component
- Property (attribute).
This hierarchy provides the basic data structure required by the risk-based process. Thus, template planning and risk ranking can partner together to optimize the work scope by focusing on reliability-focus maintenance.
Reference
- Leonard, C. Ron, and Merrick, Edwin A., "A Pilot Project for Development and Implementation of Risk-Based Inspection Methodology for Pressure Vessels," PVP-Vol. 360, Pressure Vessel and Piping Codes and Standards, ASME, Book No. H001150-1998, p. 55-57.
The Authors
Ed Merrick is director of the petroleum and chemical business unit for Aptech Engineering Services Inc. He has worked at Aptech for more than 10 years. Merrick specializes in finding practical solutions to mechanical integrity problems and in the application of risk technology. Formerly, he spent 16 years with the Tennessee Valley Authority working on mechanical integrity issues for the fossil and nuclear power industry. He holds a masters degree from the University of Tennessee, Knoxville, in materials science and a bachelors degree in mechanical engineering from Vanderbilt University, Nashville.
C. Ron Leonard is an engineering associate and group leader for the compliance technology and inspection group in the reliability technology department of Eastman Chemical Co. He has been with Eastman for 29 years. Currently, Leonard is chairman of the inspection and maintenance task group of the Chemical Manufacturers Association. He participates in the American Society of Mechanical Engineers Codes and Standards Committees. Leonard holds a BS in mechanical engineering from Virginia Tech, Blacksburg, Va., and an MBA from the University of Tennessee, Knoxville.
Phil Eckhardt is the inspection/reliability supervisor at Tesoro Hawaii Corp.'s refinery in Kapolei, Hawaii. He has been in this position for over 3 years and has 21 years of experience in petroleum refineries with expertise in developing inspection, testing, and mechanical integrity strategy. Eckhardt is a National Board boiler and pressure vessel inspector and holds an associate of science degree in non-destructive testing.
Harry Baughman is an operations manager for Fluor Daniel's technology services in Sugar Land, Tex. He is responsible for preparing bid proposals, establishing procedures, and managing projects worldwide. Currently, Baughman is testing a new template planning program based on equipment attributes. Since 1979, Baughman has worked internationally as project manager and consultant with turnarounds, shutdowns, and outages. He holds an associate of science degree from Greenville Technical College, Greenville, S.C.
