DOE Documents Alternative Fuel Success In Niche Markets
The U.S. Department of Energy (DOE) Office of Transportation and Technologies sponsors many fleet studies to evaluate the performance of alternative-fuel vehicles (AFVs) in real-world applications.
AFVs are now commercially viable in several niche applications.1 Four of these studies, conducted by DOE`s National Renewable Energy Laboratory and Argonne National Laboratory, are:
- Ethanol cars for state agencies in Ohio
- CNG cabs in Maryland
- Electric buses in Tennessee
- LPG trucks in Texas.
In these controlled studies, the effectiveness of each alternative fuel is compared to that of conventional fuels. Addressed AFV issues include cost, efficiency, and performance.
Generally, the alternative fuels represented here had lower levels of measured nonmethane hydrocarbons (NMHC), carbon dioxide (CO), and nitrous oxides (NOx) pollutants than conventional fuels, but some by only slight amounts.
Ethanol
In 1996, Ohio established a project to demonstrate the effectiveness of ethanol in its Columbus fleet operations. The state purchased 10 flexible-fuel vehicles (FFVs) and three standard gasoline-fueled cars. FFVs are designed to operate on gasoline, E85 (a blend of 85% ethanol and 15% gasoline), or any blend of both fuels up to 85% ethanol.
All vehicles in the Ohio study were 1996 model-year Ford Tauruses. All were assigned to individuals or vehicle pools at state agencies to be generally used for local trips.
The vehicle specifications for the FFV and the gasoline Tauruses were generally the same. Ford incorporated a number of design changes into its FFV model, however, to ensure that the vehicles performed well on ethanol blends.
These changes included alcohol-resistant materials in the fuel system and an alcohol-fuel sensor linked to a control module that was calibrated to compensate for varying fuel blends. In addition, the fuel tanks were larger on the FFVs because more fuel is needed to drive the same distance on E85 as on gasoline (the energy content of E85 is lower than that of gasoline).
Vehicle use during the study period was about the same for the two vehicle types. The FFVs averaged a little more than 1,100 miles/month and the gasoline vehicles averaged about 1,200 miles/month. Overall, the study vehicles accumulated approximately 14,000 miles/year, which is typical of light-duty fleet vehicles.
Vehicle operations, maintenance, and cost data were collected for 24 months. The E85 use in the FFVs averaged 63 vol %. None of the FFVs operated exclusively on E85. During the last 12 months of the study, all the FFVs used E85 at least 50% of the time, and five averaged 75% or higher E85 use.
Fuel economy, maintenance
The average fuel economy for the FFVs was about 23 mpg, lower than the 24.6 mpg average for the gasoline vehicles.
Drivers saw little difference in vehicle range, however. Ford accounted for the lower energy content of E85 by installing 18.4-gal fuel tanks on the FFVs vs. 16-gal tanks for the gasoline vehicles.
Overall, maintenance costs for these 13 study vehicles were low. These costs were higher for the FFVs than for the gasoline vehicles almost entirely as a result of special oil that Ford initially required Ohio to use for the FFVs. During the last half of the study, Ford eliminated that requirement, and the state began to use standard oil in its FFVs. This caused no performance or maintenance problems. Fleets using FFVs in the future are likely to see little or no difference in maintenance costs.
Fleets adding this type of FFV should expect somewhat higher operating costs, resulting almost exclusively from the higher cost of E85 fuel.
The average fuel cost for the FFVs was $1.50/gal during the entire study period and $1.52 for the last 12 months. On a per mileage basis, fuel cost for the FFVs was about 15% higher than for gasoline; that is, 6.55¢/mile compared to 5.01¢/mile for the gasoline vehicles.
Emissions tests
Emissions testing was conducted on two FFVs and two gasoline-only vehicles using the Federal Test Procedure (FTP, the same procedure the EPA uses to certify new vehicles).
California Phase 2 certification gasoline (designated RFG) was selected as the gasoline fuel for this testing. The E85 used in the testing consisted of 85% ethanol blended with the base RFG fuel. The FFVs were tested on both RFG and E85.
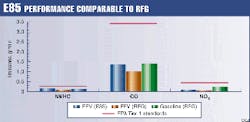
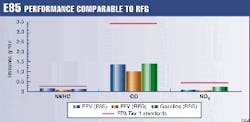
Fig. 1 summarizes the results of the regulated exhaust emissions.
Although the emissions testing in this project was limited, the results followed some trends seen in more-extensive test programs,2 3 including decreased CO and NOx for the FFVs compared to the gasoline-only vehicles. Gasoline-only vehicles, however, had slightly lower NMHC emissions than FFVs.
Regardless of test fuel or vehicle type, all the emissions results from this project were well below the EPA useful life emission standards.
Fleet feedback
The fleet experienced no difference in the overall performance of the FFVs. Except for needing special oil (a requirement Ford eliminated), the ethanol-fueled vehicles required no additional maintenance.
Overall, the Ohio staff has been pleased with the Taurus FFVs. The vehicles perform well and meet the operators` needs. The state added more than 200 FFVs to its fleet in 1997 and more than 300 in 1998. Ohio has committed to expanding its E85 fueling infrastructure.
CNG
In 1996, Barwood Inc., a taxicab company in Kensington, Md., incorporated a number of dedicated compressed natural gas (CNG) vehicles into its fleet. Incentives from the local gas utility made it possible for Barwood to gain experience with CNG vehicles without capital expenditures.
Barwood operates a fleet of about 400 vehicles, serving about 5,000 customers daily.
Drivers typically work 6 days/week, averaging 5-12 short trips and 5-15 longer trips daily. About two-thirds of their trips are city-type driving, and one-third is highway driving.
CNG is obtained at several local stations operated by Washington Gas Co. in the metropolitan Washington, D.C., area.
Operating these vehicles in Barwood`s fleet provided an opportunity to evaluate AFVs in a high-mileage application. Operations, maintenance, and cost data for the dedicated CNG and selected gasoline vehicles were collected during 12 months of vehicle operation. In addition, emissions tests were conducted at selected mileage intervals.
All vehicles in the study were Ford Crown Victoria sedans (as are approximately 90% of the cabs in the Barwood fleet): 10 were dedicated CNG models, and 10 were standard gasoline models.
The CNG vehicle uses a slightly higher compression ratio, which takes advantage of the higher octane rating of CNG to improve efficiency. Other differences include increased curb weight and reduced trunk space for the larger CNG fuel tanks, designed to store CNG and account for the lower fuel energy of CNG.
As Barwood`s drivers and maintenance staff gained experience in operating and servicing the vehicles, they found performance and reliability to be comparable or better than that of their gasoline vehicles.
Fuel economy, costs
The fuel economy of the CNG and gasoline versions of the Crown Victoria were almost identical-about 17.3 mpg (miles per gasoline-gallon equivalent for CNG). This was not surprising because the vehicles are being operated in the same types of service, and they have the same EPA-estimated fuel economy numbers.
Real differences between CNG and gasoline appear in costs. On a mileage basis, fuel costs for the CNG vehicles were more than 30% lower than those of the gasoline vehicles: 4.35¢/mile compared to 6.39¢/mile for gasoline.
During the study period, fuel averaged about 75¢/gasoline gallon-equivalent for CNG and $1.10/gal for gasoline. This can be a big advantage to a fleet.
When looking at both fuel and maintenance costs, the CNG vehicles in Barwood`s fleet cost about 25% less to operate than the gasoline vehicles on a per-mile basis. A fleet could expect to save about $1,300/year for each CNG vehicle in an application like Barwood where vehicles accumulate 50,000 miles or more annually.
In more typical light-duty vehicle service, where vehicles accumulate about 15,000 miles annually, a fleet could save about $390/year for each CNG vehicle.
Emissions tests
Seven CNG and seven gasoline vehicles were tested at odometer readings of 60,000, 90,000, and 120,000 miles using the EPA`s FTP.
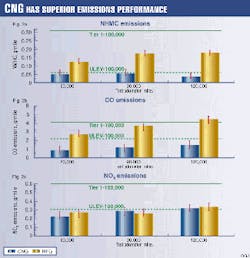
The CNG exhaust emissions were significantly lower than those of their gasoline counterparts, even when a clean RFG was used. The average regulated emissions from both the CNG and gasoline vehicles fell within the applicable EPA standards (Fig. 2), but the CNG vehicles had significantly lower levels of NMHC and CO and similar levels of NOx.
Test results also suggest that emissions from CNG vehicles may deteriorate less quickly than from similar gasoline vehicles.
This study is believed to be one of the first to independently confirm that benefits can be maintained in real-world service throughout the useful life of the vehicle-100,000 miles, which is the EPA certification standard-and beyond.
Electricity
Today, 600,000 to 750,000 passengers ride Carta`s (Chattanooga Area Regional Transportation Authority) electric buses along the 31/2-mile shuttle route each year.
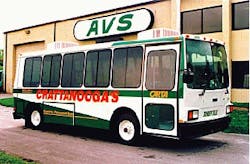
Each 22-ft electric bus (Fig. 3) can carry 22 seated passengers and about 8-10 standees; the 31-ft buses can carry 25 seated passengers and 5-7 standees. The buses stop at each block and are scheduled at 5-min intervals over 16-hr days. Depending on the season, 3-8 electric buses are on the streets of Chattanooga at any given time.
Carta`s buses have either direct current (dc) or alternating current (ac) propulsion systems. The older buses have dc systems, which are less expensive and have less complex controllers.
The ac systems in the newer buses are smaller and lighter, have more power, and are more efficient at converting electrical energy into mechanical energy. An ac system uses about 30% less electricity and weighs about 40% less than a dc system. The ac buses also seem to handle uphill grades better, but they have a lower range than the dc buses.
The range of the vehicles is affected by driving techniques, so Carta monitors driver performance. When a bus`s range is low, the driver receives additional training in operating techniques.
Battery care
Since August 1994, Chattanooga`s electric buses have been charged at Shuttle Park South, a combined electric-bus terminal and 550-space parking facility, which cost $4.2 million. Located near the south end of the shuttle route, it houses the electric vehicle maintenance facility, a battery changeout station, and the battery chargers.
Each bus has at least two sets of lead acid batteries. The battery packs for the dc buses weigh about 1,000 lb, and they can easily be exchanged in about 10-15 min. These buses usually run on a freshly charged battery pack as the depleted pack is charged.
The ac buses, on the other hand, have battery packs that weigh about 3,000 lb and are not so easily replaced. If an ac bus is needed immediately, the batteries are changed out; otherwise, the batteries are charged in place inside the bus. A full charge takes about 6-8 hr, but a rapid-charge system, being developed, should charge a battery in 2 hr or less.
Paying for itself
Operating costs for the electric buses are covered by parking revenues and lease of commercial space in the parking facilities. According to Tom Dugan, executive director of Carta: "Operating costs are basically the same for diesel and electric. Labor cost is the most expensive line item, and it`s the same for both types of buses. But there are environmental benefits to the electric buses."
No tune-ups or oil changes mean that maintenance costs are lower for electric buses than for diesel buses.
Shuttle Park North, Carta`s second parking facility, opened in June 1996. It has space for 650 cars and houses a multiscreen theater. Of the combined 1,100 parking spaces at the two parking facilities, 450 are monthly rentals, a good indication of the high usage factor of the shuttle system.
A third parking facility is being considered.
Meanwhile, Carta and the Electric Transit Vehicle Institute (ETVI) continue to develop and test electric-vehicle designs for urban and rural applications, particularly buses that can handle the uphill grades of the mountains surrounding Chattanooga. Dugan thinks the next wave of new vehicles will be the CNG/hybrid electric bus; Carta has been testing a prototype.
LPG
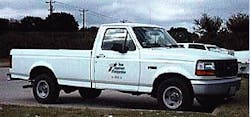
In 1996, the Texas Department of Transportation (TxDOT) decided to incorporate some 400 bi-fuel LPG pickups into its fleet (Fig. 4). The vehicle choice was based on the reasonably well-developed LPG infrastructure in Texas, the relative convenience of purchasing LPG or having it delivered on site, and the availability of an original equipment manufacturer (OEM) vehicle.
In 1996, TxDOT operated more than 5,000 AFVs, most fueled by either compressed natural gas (CNG) or LPG.
Two TxDOT districts, Houston and Corpus Christi, participated in this project to evaluate bi-fuel LPG and gasoline vehicles. All the study vehicles were 1996 Ford F150 pickups: 31 were bi-fuel LPG models and 4 were standard gasoline models.
Ford modified the bi-fuel vehicles to operate on either LPG or gasoline. The most significant differences included additional equipment to deliver LPG to the engine and control engine operation, increased vehicle weight, and the addition of an LPG fuel tank.
Ford has continued developing this vehicle since the 1996 model year. The more-recent models have improved engine calibrations and hardware. In 1998, the bi-fuel LPG vehicle was certified to EPA`s low emission vehicle standards (LEV). In 1999, Ford plans to certify this vehicle to EPA`s ultra low-emission vehicle standards (ULEV) when operating on LPG.
Usage was similar among the LPG and gasoline vehicles being studied. On a monthly basis, the LPG vehicles accumulated an average of about 1,300 miles/month compared to about 1,600 miles/month for the gasoline vehicles.
The LPG usage in the bi-fuel vehicles averaged 78 vol % for the study period. No bi-fuel vehicles operated exclusively on LPG. All but two of the bi-fuel vehicles used LPG at least 50% of the time, and 24 of them averaged 75% or more use of LPG.
Fuel costs, range
For the bi-fuel vehicles, the fuel economy includes miles driven on both LPG and gasoline. The average fuel economy for the bi-fuel LPG vehicles was 10.1 mpg, or about 12.7 miles per equivalent gallon of gasoline, which is lower than the average of 13.2 mpg for the gasoline vehicles.
The difference in volumetric fuel economy is expected, because the energy content of LPG is about 30% lower than that of gasoline. The difference in gasoline-equivalent fuel economy of the two vehicle types is not significant, given the scope of the study.
The gasoline vehicles were outfitted with two 37-gal fuel tanks. The bi-fuel LPG vehicles were outfitted with a standard 18-gal gasoline tank and a 48-gal LPG tank. As a result, the bi-fuel vehicles offer a significantly longer total vehicle range than the gasoline-only vehicles.
Operating costs include fuel usage cost and maintenance cost. Fleets owned by Texas do not pay federal taxes on gasoline, but they do pay a state tax on LPG via an annual tax on AFVs based on annual vehicle mileage and vehicle weight.
For the F150s, a tax of $168 is accessed for vehicles accumulating 15,000 or more miles annually. The annual tax adds 0.98¢/mile, or just less than 1¢/mile, to the fuel costs for the LPG vehicles, based on their average annual mileage accumulation of 17,153 miles.
The average price of gasoline during the study was $0.80/gal. In Houston, the average price of LPG was $0.50/gal. In Corpus Christi, LPG averaged $0.62/gal.
Given the relative fuel economics, a fleet would break even on fuel costs if the price of LPG were approximately 30% lower than gasoline (for example, if gasoline cost $0.80/gal and LPG cost $0.56/gal). The LPG price in the Corpus Christi district was not low enough to offset the fuel economy difference between LPG and gasoline.
Maintenance
Overall, maintenance costs for this fleet were low. With one exception, the scheduled maintenance costs were the same for the two vehicle types at $0.65/mile.
The Corpus Christi district used reusable oil filters, which increased labor costs because the filters had to be cleaned. Thus, maintenance for Corpus Christi vehicles was about $0.82/mile.
The total operating costs for the LPG vehicles were 8.31¢/mile in Corpus Christi and 7.15¢/mile in Houston. Gasoline-vehicle operating costs in the study were 6.93¢/mile. Looking at the Houston LPG costs, which are directly comparable to the gasoline results because their maintenance was the same, it cost only about 3% more, on a cents-per-mile basis, to operate the LPG vehicles.
Without the state AFV tax, the costs to operate LPG vehicles would drop about 10% below that of gasoline. This fleet`s experience shows that operating costs were higher for LPG vehicles, but vehicle performance and reliability met the fleet`s expectations and needs.
Acknowledgment
The authors thank the numerous additional contributors from the National Renewable Energy Laboratory and Argonne National Laboratory who assisted in the data collection and preparation of these reports.
References
- http://www.afdc.doe.gov
- Kelly, K., Bailey, B.K., Coburn, T., Clark, W., and Lissiuk, P., "Federal Test Procedure Emissions Test Results from Ethanol Variable-Fuel Vehicle Chevrolet Luminas," Alternative Fuel: Composition, Performance, Engines, and Systems, SP-1181, Society of Automotive Engineers Inc., Warrendale, Pa., 1996a, pp. 249-68.
- Kelly, K., Bailey, B.K., Coburn, T., Clark, W., Eudy, L., and Lissiuk, P. Light-Duty Vehicle Program Emissions Results (Interim Results from Alternative Fuel OEM Vehicles). NREL/TP-425-21294, National Renewable Energy Laboratory, Golden, Colo., 1996b.
The Authors
Kenneth Kelly develops plans for vehicle and fleet evaluation programs for the National Renewable Energy Laboratory (NREL).
He joined NREL in 1991 as a quality assurance/quality control engineer for the Alternative Fuels Data Center. In 1993, Kelly took over an extensive alternative-fuel vehicle emissions testing program. Prior to working for NREL, Kelly spent several years as a manufacturing engineer for the Nupro division of Swagelok Inc. and for Sun Power Inc.
He holds a BS and an MS in mechanical engineering from Ohio University, Athens, Ohio.
Peg Whalen is a senior engineer at NREL. She supports the DOE`s Office of Technology Utilization in the areas of alternative fuel and advanced vehicle testing and evaluation. She manages several alternative fuel vehicle projects aimed at evaluating AFV performance, use, acceptability, and costs in comparison to gasoline-only vehicles.
Prior to joining NREL in 1995, Whalen was an aerospace engineer with NASA. She holds a BS and an MS in mechanical engineering and an MS in civil engineering.
Richard L. Bechtold is a senior project manager at QSS Group Inc., through which he provides technical support services to the Department of Energy. He has 23 years experience with alternative and conventional transportation fuels.
Bechtold holds a BS and an MS in mechanical engineering from Penn State University, and a masters of administrative science from Johns Hopkins University.
David E. Rodgers is director of the Office of Technology Utilization in the Office of Transportation Technologies at the U.S. Department of Energy, Washington, D.C. He oversees alternative fuel provisions of the Energy Policy Act of 1992, including alternative fuel vehicles for the federal fleet, the "Clean Cities" program, public information, state grants, and regulatory development.
Rodgers holds a BS in chemical engineering and a BS in computer science from Washington University, St. Louis. He also holds a masters in public management from the University of Maryland.
