Top-of-Line corrosion in gas lines confirmed by condensation analysis
Experience in the Tunu field, Kalimantan (Borneo), as well as published case histories show that top-of-line corrosion (TLC) results from water condensation in wet-gas pipelines when the flow regime is wavy-stratified flow.
Corrosion can take place in both uphill and downhill pipe portions.
Evaluating the condensation rate in a wet-gas line during design, considering the coldest environmental conditions (unburied pipe sections, upheaval buckling, or non concrete-coated field joints in contact with cold river water, sea water, or cold soil during winter), can predict potential TLC.
A heat-insulation coating or thick anticorrosion pipe coating can prevent a heavy condensation rate.
Standard corrosion-monitoring systems, installed at both ends of the line, cannot detect this type of corrosion. Use of flexible ultrasonic transducer (UT) mats installed on the doglegs presents one possible solution.
Total is investigating controlling TLC by regular batch treatments with a corrosion inhibitor with high film persistency or by continuous corrosion-inhibitor injection using a volatile or three-phase corrosion inhibitor.
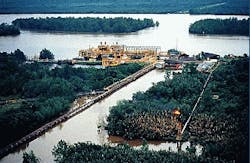
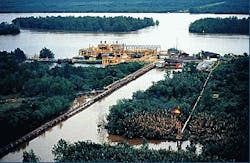
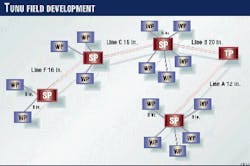
Multiphase wet gas flow lines of Tunu field cross Borneo`s Mahakam River (Fig. 1) at several locations. Even though the corrosion-monitoring systems have shown negligible internal corrosion rates, inspection by intelligent pigging of two of these flow lines after 6 years of service indicated severe internal TLC.
Corrosion occurred in three locations in one line and at two locations in the other. Lengths of the corroded pipe sections vary between 10 and 100 m.
Further investigations showed that corrosion took place where the pipes were in direct contact with river water. These were unburied pipe sections (doglegs or pipe sections where upheaval buckling occurred) subject to heavy cooling and consequently heavy water condensation.
A pipe portion was removed. Visual inspection and laboratory examination confirmed the proposed explanation. Described here are the field-operating conditions, the results of inspection and laboratory studies, and the remedial actions undertaken to solve the problem.
Critical conditions
Reported TLC cases are quite common; the first was reported in 1960 upon detection of severe localized TLC in the gas gathering system at the sour gas field of Lacq, France.1 2 The corrosion profile consisted of "sharp-edged pits which join together to form large areas of corrosion." The pitting penetration rate was about 5 mm/year.
Review of the analysis indicates that the corrosion occurred in lines with low velocities (less than 3 m/sec) and for wavy flow regimes. No corrosion was detected in lines with annular flow and high velocities. The bottom part of the pipe, protected by the inhibited effluent, was not corroded.
In a second published case, in the Crossfield pipelines near Calgary, Alta., once again TLC occurred in lines with low velocities and wavy flow regimes especially at downhill slopes. Moreover, the corrosion rate at uphill sections was on the same order of magnitude as that at the bottom of the line and was about eight times less than corrosion rate at downhill sections. Also mentioned is that the corrosion was more severe if the chloride content was high and H2S/CO2 ratio was low.3 4
In these cases, TLC was attributed to water condensation in the presence of acid gases. Because the flow regimes were wavy and flow velocities low, the inhibited liquid phases could not protect the top sections of the pipes.
TLC can be suspected whenever the flow regime is wavy and fluid velocities are low. Some TLC cases are difficult to predict, however, occurring in specific conditions that cannot be forecast by corrosion engineers during design. This was the case for the Tunu flow lines.
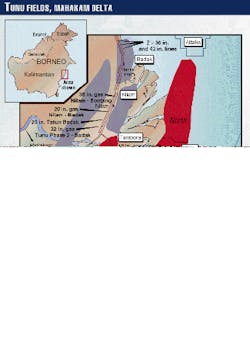
The Tunu gas field lies in the delta of the Mahakam River on Borneo. Some of the wellhead platforms are offshore. The flow lines transport wet gas and condensate from wellhead platforms (WP) to satellite platforms (SP) and then to the treatment facilities (TP; Figs. 1 and 2).
The flow lines cross the arms of Mahakam at several locations on distances varying from a few hundreds of meters to several kilometers. The temperature of the river water is about 25° C.; the water velocity 1.5-2.0 m/sec.
Production from the Tunu field started in 1990. A corrosion inhibitor has been continuously injected at each wellhead. Corrosion coupons and electrical resistance probes, which were installed at both ends of the flow lines, indicated very low corrosion rates (0.02-0.05 mm/year).
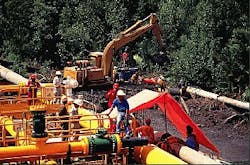
Two of the flow lines (Lines A and B, Fig. 2) were inspected by intelligent pigging in 1996. As stated, TLC was detected in some portions of these lines. A pipe portion was removed. Visual inspection and laboratory examination confirmed intelligent pigging results.
These corroded pipe sections were either unburied (doglegs) or lay in direct contact with river water as a result of upheaval buckling and consequently were subject to heavy cooling and water condensation.
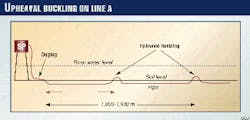
Upheaval buckling was attributed to unpredictable behavior of the soil under Mahakam. In fact, the soil and river water formed a dense mud, which caused vertical upheaval buckling instead of stabilizing the pipe during line expansion.
In some cases, river water eroded the soil under the line.
Inspections
Well effluents from three to six wellhead platforms are transported through 8-in. lines to satellite platforms where they are mixed (Fig. 2). The lengths of 8-in. lines vary from 150 to 3,500 m. There is only a test separator on satellite platforms.
Three-phase effluent is then transported by 12-20 in. flow lines from satellite platforms to the treatment platform.
Typical conditions at wellhead are as follows:
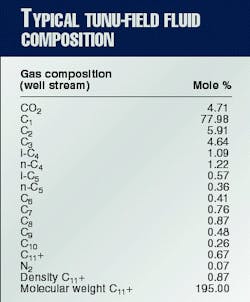
Typical well-effluent composition is given in Table 1. The compositions of water samples collected from two wellhead flow lines and from the inlet and outlet of Line A are given in Table 2.
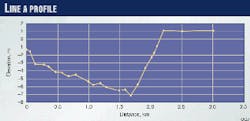
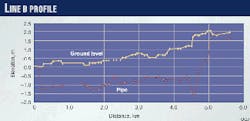
Characteristics of a few lines (including Lines A and B) and also operating conditions are summarized in Table 3 (below). Figs. 3 (at right) and 4 (below) illustrate the profiles of Line A and B, respectively. Table 4 (below) gives the steel composition for Line A.
During the project phase of field development, corrosion rates were estimated to be about 5 mm/year without inhibition.5 Assuming an inhibitor availability of 95%, carbon steel with 6-mm corrosion allowance could be used for about 20 years of service life. (Table 3 at right)
A corrosion inhibitor continuously injected at each wellhead, upstream of the choke valve, yields almost nil, the probability of corrosion inhibitor being absent in the 12-20 in. lines (lines between two SPs or an SP and TP). (Table 4 at right)
Even if an inhibitor-injection system on a WP fails, the noninhibited fluid will be mixed with the inhibited fluid coming from other wellhead platforms. The effect of dilution is negligible because the inhibitor-injection rate is based on the gas flow rate, and water flow rate is quite low in many flow lines. The corrosion inhibitor is water soluble. (Fig. 4 at right)
As to the external coating, the flow lines installed during the early phases of development are either fusion-bonded epoxy (FBE) coated or hot enamel and concrete coated. They are all buried at river crossings.
The field joint coating is of heat-shrinkable sleeve type. The doglegs (about 50-100 m) are not buried. After the second phase of development, the pipe coating was changed to three-layer polypropylene.
Results; analysis
As stated, two of the multiphase gas lines (Line A and Line B) were inspected by intelligent pigging as part of a regular inspection program. The following summarizes the inspection results:
Zone 1:
- 11 to 13 m from SP: external corrosion up to 31% W.T.
- 85 to 103 m from SP: internal corrosion up to 54% W.T. at 11:30-1:00 o`clock.
Zone 2:
- 980 to 1,028 m from SP: external corrosion up to 26% W.T.
- 1,057 to 1,077 m from SP: internal corrosion up to 63% W.T. at 11:30-3:00 o`clock.
- 1,097 to 1,270 m from SP: external corrosion up to 43% W.T.
Zone 3:
- 1,825 to 1,850 m from SP: external corrosion up to 32% W.T.
- 1,848 to 1,864 m from SP: internal corrosion up to 52% W.T. at 10:00-3:00 o`clock.
- 1,917 to 2,200 m from SP: external corrosion up to 36% W.T.
Apart from these three sections, there is no sign of internal corrosion anywhere else in the line.
Zone 1: 81 to 162 m: internal corrosion up to 50% W.T. at 11:00-1:00 o`clock.
Zone 2: 2,175 to 2,277 m: internal corrosion up to 27% W.T. at 10:00-3:00 o`clock.
Except for these two sections, there is no sign of internal corrosion anywhere else in the line.
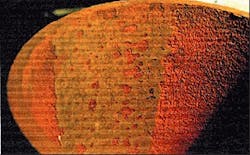
Zone 2 of Line A was cut out for analysis. The visual examination (Fig. 5) showed the following:
Condensation
In Line A, the flow regime is wave flow. The flow velocity of 3-12 m/sec (average velocity being 7-8 m/sec) is not excessive. The estimated maximum wall shear stress is about 40 Pa, and the estimated critical velocity for inhibition is about 15 m/sec.5
The corrosion-erosion and inhibitor removal is therefore unlikely. As the corrosion occurs at the top-of-line location, water condensation at the corroded sections is the cause.
This portion, especially at the top of the line (Fig. 5), is therefore in contact with the cold water of the river that has velocities up to 2 m/sec. Because the gas is water saturated and the fluid temperature high, water condensation from cooling of the pipe is likely.
In such conditions, this section of the line behaves like a heat-exchanger tube.
There is external corrosion on both sides of the internally corroded portions, the result of pipe movement and consequently pipe-coating damage.
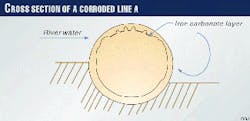
The presence of an iron carbonate layer at the top of the line (Figs. 6, above and 7, at right) is most probably the result of condensed water droplets not flowing down under a gravity effect because the inclination is insufficient. These droplets are then saturated in iron.
Even though the pH of a freshly formed water drop is about 4.1, the pH of the saturated water is almost 5.2 (Table 5), which may explain the presence of iron carbonate. According to inspection results, this scale is not very protective.
There could be at least two explanations:
- Once a water drop is formed, a competition ensues between dissolution of iron carbonate which tends to saturate the condensed water and increase water-drop size which tends to decrease the iron concentration. Therefore, the protective scale may be partially or totally dissolved under a water drop. This location becomes a weak point or an anodic zone. After initialization, localized corrosion will develop.
- Cyclic pipe movement (fatigue) as a result of upheaval buckling could frequently rupture the iron carbonate layer on the internal surface. The heavy internal-thickness loss could be the result of combined fatigue and water-condensation effects.
Side areas of the internal pipe sections above the liquid level were severely corroded by nonsaturated water drops flowing down under the gravity effect. The visual examination confirmed the "washing" effect exercised by condensed water drops.
Velocity
In reported case histories, only downhill sections of pipes were corroded from wavy flow regimes.1-4 In Line A, even though the second corroded zone was a downhill section, the first zone (dogleg) and the third zone were uphill sections.
The flow-regime predictions showed that the flow regime was wavy flow all along the line. This means that TLC took place not only in downhill sections but also everywhere the flow regime was stratified or wavy flow.
In the Tunu lines, the average flow velocity (Table 5) was generally much higher than in the Lacq gas-gathering lines and in the Crossfield lines. The flow-velocity limit for TLC (3 m/sec, suggested for Lacq) did not work for Tunu lines. It seemed that the most important parameter was not the flow velocity but once again the flow regime.
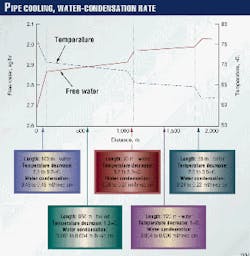
At Zone 1 (dogleg of the Line A), the estimated water-condensation rate is about 0.4-0.5 ml/(hr*sq cm) (Fig. 8).
It is assumed that 50% of the pipe surface was in contact with the river water (Fig. 5). The iron content of the saturated water is estimated to be 80-100 mg/l. The corrosion rate would be about 0.5 mm/year, assuming that the water-iron saturation controls the corrosion rate.
The actual corrosion rate is about 1.3 mm/year in Zone 1 and about 1.5 mm/year in Zone 2. These values are also much higher than predicted by Olsen and Dugstad.6
According to their prediction, the corrosion rate should be less than 0.2 mm/year at temperatures of about 80° C. The reason may be that the corrosion is localized at the top of the line.
For example, under the following assumptions:
Therefore, the estimated corrosion rate in the pit is about 1.4 mm/year.
In Line B, as in Line A, the corrosion is of top-of-line. There was no external corrosion because the concrete coating protected the FBE coating.
The presence of the concrete coating, however, was insufficient to prevent water condensation. Again, water condensation was the cause of the top-of-line corrosion.
In spite of efforts by the oil and gas industry in the last 30 years, predicting the CO2 corrosion rate in a bulk solution has yet to be achieved.
The corrosion-rate prediction in dewing conditions is apparently much more complicated. For now, it is more reasonable to concentrate efforts on preventing TLC (prevention of water condensation) rather than on predicting the corrosion rate in such conditions.
The water condensation-rate limit for TLC occurrence (condensation rate greater than which the formation of protective iron carbonate films is unlikely) needs study, however.
Remedial actions
Two points are critical in controlling the TLC in Tunu lines:
Total decided to inspect these sections regularly and to install permanent corrosion-monitoring systems (flexible UT mats, for example) on some future lines to monitor evolution of the loss of thickness. This was based on the fact that the standard corrosion-monitoring system, which is installed at both ends of the lines, cannot detect this type of corrosion.
Efficiency of regular batch treatments of a corrosion inhibitor with high film persistency or continuous corrosion-inhibitor injection with a three-phase or volatile corrosion inhibitor is being evaluated.7
In the long term, installation of a heat-insulation system on all future doglegs is an acceptable solution to prevent TLC. Extension of the ethylene-propylene-diene monomer riser coating to the doglegs has been envisioned.
Use of internally clad doglegs can be an alternative to heat-insulation coating. Remedial actions for upheaval-buckling prevention are also under investigation.
During design of future development, the condensation rate in the wet gas lines will be evaluated with consideration given to the coldest environmental conditions (unburied pipe sections, upheaval buckling, or nonconcrete coated field joints in contact with cold river water or sea water).
Acknowledgment
The authors would like to thank Total Indonesie for permission to publish this article and Total`s X. Watremez and G. Woodward for their contributions to the calculation of water-condensation rate.
References
- Estavoyer, M., "Corrosion Problems at Lacq Sour Gas Field," NACE publication "H2S Corrosion in Oil and Gas Production," Houston, 1981, p. 905.
- Pailassa, R., Dieumegarde, M., and Estavoyer, M., "Corrosion Control in the Gathering System at Lacq Sour Gas Field," NACE publication "H2S Corrosion in Oil and Gas Production," Houston, 1981, p. 860.
- Ho-Chung-Qui, D.F., and Willamson, A.I., "Corrosion Experiences and Inhibition Practices in Wet Sour Gas Gathering Systems," Corrosion/87, Paper No. 46.
- Bich, N.N., and Szklarz, K.E., "Crossfield Corrosion Experience," Corrosion/88, Paper No. 196.
- Gunaltun, Y.M., "Combining Field Data and Research Results for Corrosion Rate Prediction," Corrosion/96, Paper No. 27.
- Olsen. S., and Dugstad, A., "Corrosion under Dewing Conditions," Corrosion/91, Paper No. 472.
- Kharshan, M., and Furman, A. "Incorporating Vapour Corrosion Inhibitors (VCI) in Oil and Gas Pipeline Additive Formulations," Corrosion/98, Paper No 236.
The Authors
Yves M. Gunaltun is a senior corrosion engineer at Total Exploration & Production, Technology Division, Paris.
Gunaltun was involved in Total projects 1982-86 as a corrosion engineer and was seconded to Zadco (U.A.E.) in 1987 and to the Qatargas LNG project in Houston in 1992. He has been involved with all Total projects since 1993. Gunaltun holds a PhD from I.N.P.G. (France).
Deden Supriyatman has worked in corrosion for Total Indonesie since 1984. He previously worked in the National Atomic Energy Agency as a metallurgical engineer. Supriyatman graduated from Institute of Technology Bandung, Indonesia, in 1983 and is a member of NACE and the Society of Indonesian Petroleum Engineers.
Jamaludin Achmad has worked for Total Indonesie since 1993. He graduated from the Institute of Technology Bandun, Indonesia, in 1991 and is a member of NACE and the Society of Indonesian Petroleum Engineers.
