Coalbed methane production shows wide range of variability
Dean E. Gaddy
Drilling Editor
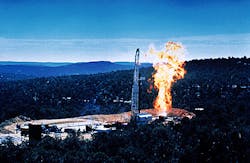
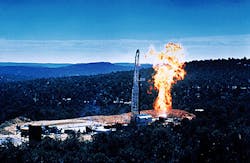
This well, located in the "fairway" of the San Juan basin, northern New Mexico, just finished a procedure in which the pipe rams were shut-in to pressurize the coal seams. After a period of time, the rams are opened and the pressure is vented through the blooie line at surface. This process of cavitation creates an underground chamber that expands the contact of the cleat system with the well bore, increasing its near well-bore permeability (Fig. 3).As compared to conventional gas plays, the production distribution of coalbed methane (CBM) shows a wide range of variability that can mislead development strategies.
"That's the problem with CBM, it is difficult to understand the productivity of your play with only a few wells," Charles Boyer, senior geologist for S.A. Holditch and Associates, told Oil & Gas Journal. "If you are going to develop a CBM play, you must drill enough pilot wells to characterize the distribution of productivity."
Reserve calculations
Fig. 1 [53,425 bytes] represents the range of reserves for wells in the Appalachian, Black Warrior, and San Juan basins, extrapolated through a five-step procedure.![Fig. 1 [53,425 bytes]](http://images.pennwellnet.com/ogj/images/ogj3/9717jga01.gif)
First, data are collected from those wells that have produced over an extended period of time, say 10 years. These wells comprise a smaller subset that will be used as a point of correlation with all producing wells in the field.
Second, this base set of 10-year-old data is evaluated and extrapolated to estimate the total final cumulative production or total reserves for each particular well. The 10-year baseline serves as an excellent baseline because about 80% of CBM cumulative production occurs by this period of time.
Third, these 10-year data are then plotted against an early time indicator that provides a good point of correlation (Fig. 2) [34,486 bytes], in this case, the best 24 months of production for that same well. At this point, the graph provides a good correlation between these two parameters, and the best-fit line then becomes the correlation factor.
![(Fig. 2) [34,486 bytes]](http://images.pennwellnet.com/ogj/images/ogj3/9717jga02.gif)
Fourth, the correlation is applied to every well in the basin to predict the total cumulative production for each well. Finally, from the total reserves for each well, it is possible to generate the probability distribution that is shown in Fig. 1.
"What this says is that if we take the best 24 months of gas production for a well, which typically occurs in the first 2 to 4 years, we can predict what the 10-year cumulative production will be. From there, we can determine what the total cumulative production will be for that well," said Mike Zuber, vice-president of S.A. Holditch & Associates.
Basin comparison
Using this information, it can be seen that median well reserves for the Black Warrior and Appalachian basins encompass about 350 MMscfd/well, whereas the San Juan basin holds about 750 MMscfd/well (Fig. 1)."The San Juan shows a wide range of variability, about two orders of magnitude from the 10th to 90th percentile (y-axis, Fig. 1). The Warrior and Appalachian basins and conventional oil and gas plays typically display only one order of magnitude," Boykin said, "making it much easier to plan development strategies."
The San Juan CBM reserves are higher because these wells typically have a higher gas-in-place volume per well (Table 1 [8,165 bytes]). Furthermore, San Juan CBM reserve distribution is skewed to the higher end of reserves (Fig. 1), caused by a "fairway" of high production (Fig. 3).
![Table 1 [8,165 bytes]](http://images.pennwellnet.com/ogj/images/ogj3/97174201.gif)
"The conditions that cause the 'fairway' to produce at such prolific rates are apparently unique," said Zuber.
A statistical strategy
Thus, CBM development requires a strategy based on the statistical understanding of gas-reserve distribution, requiring large, multiwell development programs that are designed to spread the productivity risk among a large number of wells.For example, on the 80th percentile for the San Juan basin curve, the reserves are about 3 bcf". What this says is the chances of drilling a well that has reserves of 3 bcf or higher would be 20%, or conversely, the chances of drilling a well with reserves between 0 and 3 bcf are 80%," Boyer said.
"So, if a developer comes to you and says he has a San Juan basin play with proved reserves of 5 bcf/well, you can refer to (Fig. 1) and determine for yourself the odds of finding the mother of all sweet spots."
Copyright 1999 Oil & Gas Journal. All Rights Reserved.