Fluid dynamics visualization solves LNG plant recirculation problem
Jon Berkoe
Bechtel Technology & Consulting
San Francisco
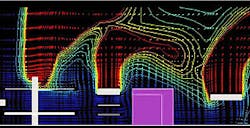
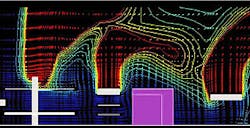
Plot of velocity vectors superimposed on temperature contours shows recirculation effects. These results indicate the importance of equipment position (Fig. 2).
Computer simulation helped Bechtel engineers solve a potential recirculation problem at Atlantic LNG Co.'s liquefaction plant nearing completion at Point Fortin in southern Trinidad.
- Flow streak lines for airflow entering and exiting the equipment along with the wind demonstrate the mechanisms of recirculation and beneficial updraft of the gas-turbine exhaust plumes (Fig. 3). [25,388 bytes]
- Recirculation occurred only at off-normal wind directions when exhaust from turbine generators and recirculation from the condensers were entrained (Fig. 4). [8,052 bytes]
The plant uses Phillips Petroleum Co.'s Optimized Cascade process (Fig. 1 [107,023 bytes]).
After the plant was designed but before it was built, management recognized that wind-induced recirculation of the turbine and condenser exhaust could cause operating problems. Bechtel engineers simulated the entire plant with computational fluid dynamics (CFD) to predict the temperature profiles entering the coolers under various wind directions and speeds.
Use of a CFD post-processor to develop particle traces from the turbines and condensers to the cooler inputs helped engineers understand the problem and obtain a solution.
Experimental approach
When natural gas is cooled to approximately -260° F. at atmospheric pressure, it condenses to a liquid. One volume of this liquid takes up about 1/600th the volume of natural gas at a stove-burner tip.Atlantic LNG's plant uses fin-fan air coolers for cooling and condensing the process gas. Both the gas turbines and condensers emit high volumes of hot exhaust air. If this air were to be sucked into the intake of the condensers, the operating margin of the plant would be reduced.
Bechtel was asked to determine whether a problem existed and, if so, to recommend a solution. This type of problem would be nearly impossible to solve with the traditional experimental approach: Building a model and testing it in a wind tunnel would be expensive and, because of the difficulty of instrumenting the model, might not even lead to a solution.
Over the past several years, Bechtel engineers have had considerable success in addressing this type of problem with CFD. A CFD analysis provides fluid velocity, fluid temperature, and fluid concentration values throughout the solution.
The results of the analysis allow a designer or an engineer to optimize fluid-flow patterns or temperature distributions by adjusting either the geometry of the system or such system operating conditions as inlet velocity and/or temperature and wall heat flux.
CFD also can provide detailed parametric studies that can significantly reduce the amount of hardware experimentation necessary to develop a prototype and thus reduce design cycle times and costs (Fig. 2).
Software selection
Bechtel engineers selected FIDAP CFD software from Fluent Inc., Lebanon, N.H., as their modeling tool. This software package is a finite-element code, rather than a finite-difference code, which gives it the advantage of using nonstructured grids. Nonstructured grids automate the process of fitting elements to the complex geometries used in this application.To gain greater insight into the problem, Bechtel engineers used FIELDVIEW from Intelligent Light, Lyndhurst, N.J., because of the program's wide range of visualization features.
It has the ability to create a surface depicting gas flow or temperature anywhere within the model and subsequently to sweep the surface throughout the entire plant to locate areas of high-speed flow or high temperature which might adversely affect plant operation.
FIELDVIEW is compatible with most leading commercial CFD solver codes including FIDAP, CFD-2000, VISIUN, GASP, COMPACT, FLOW-3D, FLUENT, RAMPANT, FLUENT/UNS, STAR-CD, CFX, PHOENICS, TASC FLOW, and NASA's PLOT3D format.
The latest release of the program, Version 5.5B, contains breakthrough technology for processing large transient CFD problems.
Bechtel engineers "built" a model of the LNG plant including six gas turbines, air coolers, condensers, three nearby small turbine-generators, and pipe racks. The engineers also modeled the compressor buildings as well as nearby structures.
They used local weather data to construct a series of profiles including ambient temperature and wind direction and speed. These were used to generate a series of alternative environmental boundary conditions for the CFD model.
Analysis
The analysis results showed that under certain weather conditions, temperatures in the air cooler intake would be high enough to have a major negative economic impact.Surprisingly, the worst-case scenario was not high or low wind conditions but rather somewhere in between. The reason, revealed by the analysis, was that in low winds, buoyancy effects dominate to the extent that the exhaust heat is thrust into the atmosphere. On the other hand, very high winds tend to disperse the exhaust gases.
The greatest problem came when winds were at a medium level and neither the buoyancy nor the dispersion effects were strong enough to dominate. It was clear that a design change needed to be made immediately since construction was about to begin.
Particle traces
The traditional tables and charts that were generated by the analysis plainly indicated that temperatures at the condenser intakes were high enough to cause problems. Unfortunately, the traditional output was of limited help in solving this problem because it did not clearly distinguish which of the heat sources was having the most impact.Bechtel engineers used FIELDVIEW to create particle traces starting with seeds at the exhaust outlets of the turbines and air coolers. These traces showed the path of the hot exhaust gases from each heat source (Fig. 3).
The engineers also ran reverse traces from the air cooler intakes to determine the source of the air. These traces gave considerable insight into the problem.
The engineers could see that virtually none of the exhaust from the large gas turbines was being recirculated. For the most common wind direction, there was virtually no recirculation anywhere.
One key reason was that the open housing of the turbines allowed air to flow directly to the air cooler and condensers. Another reason was the beneficial effect of the strong buoyant draft created by the gas turbines that helped to "pull" much of the air-cooler exhaust upward instead of being recirculated.
The only recirculation occurred at off-normal wind directions where exhaust from the turbine generators and recirculation from the condensers were entrained (Fig. 4).
Engineers evaluated several design concepts in an effort to solve the problem. For each concept, they re-ran particle traces using FIELDVIEW in order to see the impact on the flow patterns.
These analysis iterations showed that one alternative that had intuitively seemed promising, putting a baffle around the condenser exhaust, actually was ineffective because it failed to prevent the exhaust from neighboring units from being pulled in.
Using the analysis results to guide them, engineers iterated to a solution that completely eliminated mixing and recirculation of the exhaust air. This involved moving the turbine generators away from the condensers, raising the height of the exhaust stacks, and adding a side skirt on the condensers.
Iterative analysis allowed them to determine optimum dimensions for the side skirt-those that would eliminate the problem.
The next step was presenting the new design to plant management.
Using the FIELDVIEW post-processor, Bechtel engineers developed a presentation that graphically showed the problems with the existing design and how the new approach fixed them.
They began the presentation with a series of plots with each successive slide adding a new source of exhaust. Then, they showed a series of plots based on the new design that showed how their proposed modifications eliminated mixing and recirculation.
A unique feature of the post-processor that aided the presentation is its ability to modify the presentation interactively, to turn a trace on or off in response to questions, for example.
The Author
Jon Berkoe is a principal engineer with Bechtel Technology & Consulting, San Francisco, where he manages a computational fluid dynamics research and consulting group. In addition to performing technical analyses, he is responsible for the marketing and business development of CFD services at Bechtel. Berkoe holds BS and MS degrees in mechanical engineering from the Massachusetts Institute of Technology and has 15 years' experience as a specialist in fluid dynamics and heat transfer. He is a registered mechanical Engineer in California.
Copyright 1999 Oil & Gas Journal. All Rights Reserved.


