DOT stats indicate need to refocus pipeline accident prevention
Diane J. Hovey, Edward J. FarmerAnalysis of the most recently available data from the U.S. Department of Transportation (DOT) 1 indicates that, despite emphasis by regulators and operators, the rate at which pipeline accidents occur shows no significant change over the last 16 years.
EFA Technologies Inc.
Sacramento, Calif.
That is the result of an update by EFA Technologies Inc., Sacramento, to its initial study of DOT pipeline-safety statistics (OGJ, July 12, 1993, p. 104).
Since accident frequency, therefore, has failed to benefit from substantial effort devoted to its reduction, perhaps operators should shift their emphasis: Accepting the premise that there is going to be some minimum number of accidents can lead to refocusing on ways to reduce their impact.
Such a shift in emphasis may be the best way to get the most "bang for the buck" in dealing with apparently inevitable accidents.
The unavoidable statistical truth is that even short, simple pipelines will have a reportable accident during a 20-year lifetime. Operators of long pipelines (1,000 miles or so of line pipe) can expect a reportable accident every year. In essence, if you operate a pipeline you are going to have an accident.
Moreover, conventional wisdom that pipelines are a very safe way to move petroleum products rarely persuades regulators and the public, especially in the aftermath of a pipeline accident.
Construction and operating permit hearings, as well as negotiations leading to post-accident consent decrees, are often haunted by the 6 people who died, the 26 people who were injured, the 39 fires, the 13 explosions, and more than 95 million gal of hazardous liquid spilled in 1988-98 as a result of accidents on pipelines or in pipeline-related facilities.
Intensity, mechanisms
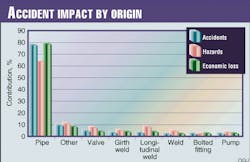
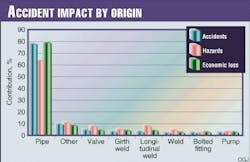
DOT statistics accumulate accident-intensity data into six categories: property damage, stock loss, fires, explosions, injuries, and fatalities.EFA Technologies aggregated them into two categories: Hazards, which combines fire, explosion, injury, and fatality; and economic loss which includes property damage and stock loss. Analysis is in terms of the percentage of the total in the DOT database.
If all accidents were of equal impact, a category such as "Line pipe" that is responsible for 79% of the accidents would also be responsible for 79% of the hazard and 79% of the economic loss. Focusing more productively requires identifying accident mechanisms that produce hazard or economic loss out of proportion to their frequencies of occurrence.
There are two ways to think about initiation of an accident: in terms of the component that failed or the activity from which the accident evolved.
DOT identifies pipeline components as line pipe, valve, pump, appurtenance weld, girth weld, longitudinal weld, bolted fitting, and "Other." Fig. 1 shows accident frequency, hazard, and economic loss for each. If each component contributed equally to hazard and economic loss, each of the three bars would be the same length.
Clearly, "Line pipe" as a category is responsible for most of the accidents and a commensurate percentage of the economic loss but something less than its expected portion of the total hazard. It is responsible for 68% of the fires, 71% of the explosions, 57% of the injuries, and 43% of the fatalities.
The magnitude of its impact supports continued focus on it as an accident-producing component, but the approach may be productively modified by considering the causal activity (discussed presently).
The expanded scale inset shows that leaks originating at valves, welds, and pumps are proportionally more hazardous than their frequencies would suggest, but their total impact remains small compared to line pipe.
Causality
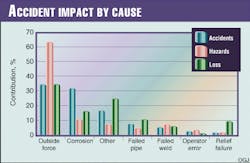
DOT identifies seven cause categories: outside force, corrosion, other, failed pipe, failed weld, operator error, and relief failure. Fig. 2 shows the relative contribution of each.Clearly, outside force is a disproportionately hazardous way to have a pipeline accident: It is responsible for 38% of the fires, 35% of the explosions, 34% of the injuries, and 29% of the fatalities. The corrosion accidents so much worried about are frequent but contribute less than their proportionate share to economic loss and hazard.
This suggests an additional dollar spent reducing outside-force accidents will produce more value than the same additional dollar spent reducing corrosion accidents.
The "Outside force" category contains a small number of natural events (such as earthquakes), but most occurrences are "human error" accidents (third-party damage by contractors, farmers, utility workers, etc.). Actions of people not employed by the pipeline operator account for 49% of the property damage and 20% of the stock loss.
"Operator error" was listed in only 3% of the pipeline accidents and most frequently associated with weld failure. This category contained 15% of the fires and 6% of the injuries but no fatalities.
"Corrosion," while accounting for 32% of the accidents, is significantly less dangerous and less costly than the other major categories. Frequently, valves, welds, and bolted fittings are by hearsay labeled as the most common source of reported accidents. In fact, when all these accidents are combined, they only account for 14%; individually, each is barely visible on the "Accidents by origin" chart.
Additionally, studies and research projects often focus on girth and longitudinal weld accidents. The attention these accidents receive may be due to the their relatively high percentage of property damage coupled with injuries and fatalities (one death and four injuries).
Taken together, these two categories approach "Other," the second largest cause of explosions, injuries, fires, and fatalities.
None of the accident reports described start-up or transitions in operation as a cause or contributing factor.
In either figure, it is hard to ignore "Other" as a significant contributor, responsible for 71% of the fatalities, 46% of the injuries, 38% of the fires, and 35% of the explosions. The narrative portion of the accident reports provides some insight into why the operator had trouble selecting one of the standard boxes on the form.
It turns out that "Other" is a collection of accidents that are sometimes the result of unusual circumstances but most often would be more correctly listed in "Outside force" or "Operator error." Examples include vandalism, train derailment, and improper operation of manual valves.
What the narrative says
A recurring theme, evident in the narrative but not by the boxes checked, is that more often than not, facility personnel and outside contractors were involved in situations where existing safety practices were not observed. Because these are human error situations, they will never be reduced to zero. (Data shown in Figs. 1 and 2 have not been adjusted to incorporate information from the narratives.)Although the accident report form does not include a "how detected" category, the narrative portion often describes how it happened. Knowing about the leak soon after its occurrence is the cornerstone of effective mitigation and reduction of stock loss and property damage.
Even so, a large proportion of the accident reports describes the operator being notified by a passing motorist, the police, or a railroad engineer as opposed to being detected by intentional monitoring programs.
A related study of accidents that take place in rights-of-way, determined that 66% of the accidents occurred where pipelines cross property controlled by others.2 These were the result of actions by people not directly employed by the pipeline operator.
Finding the payback
The best opportunities to decrease accident impact are in addressing the human element. The next most productive improvement comes from better pipeline-monitoring equipment and practices. The accident reports suggest the following lessons:- Assign the most knowledgeable person available as the safety coordinator or inspector for right-of-way excavations. A person trained in U.S. Occupational Safety and Health Administration (OSHA) requirements alone is insufficient and may actually create problems.
- A "One-call" system is fine as far as it goes, but in many cases the reports show that persons attending preconstruction site walks and meetings were absent when the work was done. The pipeline company's operating representative, the contractor's foreman, and the equipment operator assigned to the project should all be present for the preconstruction site walk. This helps with scheduled work, but many third-party accidents result from routine road maintenance, farm work, and other unannounced activities.
- Enforce existing safety and maintenance programs. Keep the manuals current.
- Mark the pipeline. Of the pipelines damaged during the study period, 68% were unmarked near the point of damage, which suggests additional signs could help.
- After prevention, mitigation through state-of-the-art continuous pipeline monitoring is the most effective action. Early warning of a leak and identification of the location provide time for safe shutdown and rapid dispatch of cleanup crews.
References
- U.S. Department of Transportation, Code of Federal Regulations (CFR) Title 49D, Part 195, Transportation of Hazardous Liquids by Pipeline, Accident Report Database 1982-1997.
- Hovey, Diane J., and Farmer, Edward J., "Pipeline Crossing Accidents and Leak Detection Opportunities," presented to the ASCE Specialty Conference, June 1996, Burlington, Vt.
The Authors

Diane J. Hovey has been involved in pipeline leak detection since 1991 during which time she prepared five statistical studies based on the DOT accident-report database. Before becoming involved in leak detection, Hovey worked as a design engineer for refinery and pipeline projects and was lead engineer for Ed Farmer & Associates Inc., Sacramento. She holds a masters degree (1973) from the University of Hawaii.

Edward J. Farmer is president of EFA Technologies Inc. which he founded in 1975. He holds degrees in electrical engineering and physics from California State University, Chico, and is a registered professional engineer in California, Nevada, Illinois, and Washington.
Copyright 1999 Oil & Gas Journal. All Rights Reserved.