Greek refinery uses data reconciliation to calibrate instruments
Nikolaos G. Voros, Chris T. Kiranoudis, Dimitrios Marinos-KourisAn on-line data reconciliation system (DRS) has been developed for the diesel production process of the Hellenic Aspropyrgos Refinery SA's refinery in Aspropyrgos, Greece.
National Technical University of Athens
Athens, Greece
The new system successfully recognizes and prompts the operator of malfunctions in specific instrumentation.
Many process control and optimization systems collect large amounts of process data to make small improvements in process performance. Errors in process data or unreliable methods of dealing with these errors can mask actual changes in process performance. Data reconciliation is a process that adjusts raw measurements to eliminate errors and measurement noise The DRS assesses the operational performance of field instrumentation and creates proper calibration curves for problematic instrumentation. It uses plots of reconciled-against-measured data to produce a reliable mass balance for the plant. Reconciled data are transformed sets of the original process data that better satisfy the mass balance equations of key processes.
The system uses original process data retrieved from a real-time database of the refinery, to which the DRS is connected by a Microsoft Excel worksheet.
The data reconciliation method for the Hellenic Aspropyrgos refinery (HAR) analyzes and assesses the instrumentation behavior of real-plant process data. It is based on an overall mass balance, mathematical model of the refinery's diesel process scheme. The diesel process is briefly described in this article, and the results are analyzed and discussed.
Data reconciliation methods
Assessing the performance of field instrumentation is necessary to produce a reliable mass balance for the plant. Calibration curves for problematic instrumentation can be easily created, using plots of reconciled-vs.-measured data.The most common approach to data reconciliation in industry formulates a least squares problem, but the successful application of a least squares solution relies on the errors being normally distributed with zero mean.1
In practice, process data also contain other types of errors caused by nonrandom events. Common examples are calibration errors and instrument malfunction. To safely use the least squares approach, it is essential to check for the presence of such errors in the measured data in order to eliminate measurements corresponding to them.2 3
The detection of instrumentation errors can be achieved by an appropriate data-reconciliation technique. In this case, instrument malfunctions are implied when biased distributions of errors are detected.
Process description
The HAR diesel-processing scheme is presented in Fig. 1 [94,426 bytes]. The two crude-distillation units produce diesel in the form of heavy gas oil (HGO) and light gas oil (LGO). The light component of diesel is either stored in the LGO tank or blended with other components to produce the final product (fuel oil).Part of the LGO produced in the crude units is fed to the hydrodesulfurization (HDS) unit. The HDS unit removes most of the sulfur content from the LGO. The intermediate desulfurized product is then used as a diesel-blending component. The same applies for the HGO component.
Another source of diesel in the refinery is the fluid-catalytic cracking unit (FCCU). Part of the diesel from the FCCU is stored in the light cycle oil (LCO) tank. The rest is either directly used for blending or fed to the desulfurization unit.
The whole process involves four major refinery processes, three storage tanks, and 21 streams. For each process stream, there is a corresponding flow rate measurement device. Each tank is equipped with a level indicator, which continuously measures its stored contents.
All the previous process measurements are automatically recorded in the distributed control system (DCS) of the plant and are archived in a real-time database management system (Rdbms). Thus, the data are available for every operational period.
Steady-state data reconciliation
A data reconciliation application was developed for HAR to detect any instrumentation malfunction in the diesel production scheme.The system is modeled in a Microsoft Excel Workbook, which is interconnected with the Rdbms of HAR. The information flow between the components of the data-reconciliation system and the rest of the software and hardware components of the refinery is presented in Fig. 2 [94,153 bytes].
The DCS records and provides continuous measurement of process variables (flow rates, tank levels, temperature, and pressure), the controllers' set points, various process status flags, as well as process characteristics.
The Rdbms collects and processes data from the DCS; the data are compressed and archived. The Rdbms supports data-retrieval operations and simultaneous execution of statistical functions (for example, minimums, maximums, averages, standard deviations, and variances) over a specific operating period. The results, which are raw or transformed data, are made available as objects to spreadsheet and database applications. Customized applications using these objects perform specific tasks, such as process monitoring, process troubleshooting, and process performance analyses.
The DRS consists of three basic components: the data-retrieval module, the process model, and the data-reconciliation objective function.
The data-handling worksheet includes various graphical controls (buttons) that allow the user to retrieve any kind of data already stored in the archive file of the Rdbms. Data retrieval is automated by worksheet functions residing on the Excel worksheet. Graphical representation of process data is achieved via custom-made process flowsheets, such as the one in Fig. 1. The user is able to monitor the values of all process variables corresponding to specific measuring instruments on a monitor.
The process model is set up in a separate worksheet. It consists of overall mass balances for each stream node of the flowsheet.
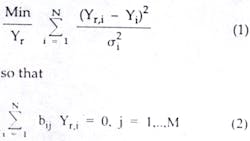
The objective function of the data reconciliation problem is formed by the sum of squares of weighed deviations between the measured and reconciled data.
The optimization is carried out using the Excel Solver algorithm. The results of the data reconciliation program are presented both on the process flowsheet and on separate diagrams. The DRS also includes functions for evaluating the instruments' deviation as well as diagnostic tools for the recognition of faulty instrumentation.
The data reconciliation problem can be stated as a constrained, least-squares estimation problem, where the weighted sum of errors is to be minimized, subject to the constraints:
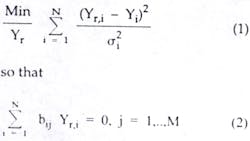
The coefficient bij is an index equal to 1 when the ith stream enters the jth node, -1 when the ith stream leaves the jth node, and 0 when the ith stream is not connected to the jth node.
Assuming zero nondiagonal elements for the error covariance matrix (that is, the measurement of an individual flow rate is not affected by any others), a standard deviation, si, is proposed for each variable. The standard deviation array is always evaluated from historical data of the process corresponding to the specific flow rate measurements.The specifications of all instrumentation involved in the diesel production scheme of HAR are shown in Table 1 [105,664 bytes]. The minimum and maximum values along with measuring units for each instrument are presented. Mean and standard deviations, as calculated by historical data, are also listed.
FIC are flow indicators, FRC are flow recorders, and LI are storage-tank level indicators.
Because most values express volumetric flow rates, the derivation of mass balance equations (Equation 2) has been evaluated by appropriate density values. The densities correspond to the individual stream in each node and were measured independently in the laboratory.
Test period
Measurements for two 3-day periods of steady-state operation of the plant were retrieved from the Rdbms to assess the reliability of measurements made by the process instrumentation. For this purpose, average data for 1, 3, 8, and 24-hr periods were evaluated for the 6 days.The developed DRS produced reconciled data for each stream involved in the process. The graphical user interface showed results obtained by the DRS (Fig. 3 [87,934 bytes]). In Fig. 3, for each instrument, a vertical bar represents the process variable's measuring range by means of a fraction of the span.
A span is defined as the maximum measuring range for each instrument. The median (as a fraction of a span) for each process variable is represented by the horizontal lines within the vertical bars. The height of the vertical bar is the standard deviation of the measured value.
In cases where reconciled data points (medians) lie within the allowable measuring range, data reconciliation is considered successful, and no biases are detected for the specific instrument. Otherwise, instrument malfunctions are indicated. Instrument deviations are also highlighted on the process flowsheet of the Rdbms user interface when gross errors are detected.
The mean deviation and corresponding standard deviation of all instruments in the diesel process flowsheet are presented in Table 1. All measurements are unbiased, except the four measuring devices corresponding to streams entering and leaving the HDS unit (FIC 34004, FIC 34072, FIC 34006, FIC 34055). In these cases, the mean deviations are extremely biased, indicating serious malfunctions of the instruments involved or incorrect calibration of them.
Sample results for two process instruments with no bias are presented in Fig. 4 [63,254 bytes]. These instruments belong to the LGO tank level indicator (LI 88103) and the flow recorder (FRC 84008) for the LCO stream to the fuel-oil blending subsystem.
In the diagrams of Fig. 4, measured plant data (Y) are plotted against reconciled data (Yr). As clearly indicated by the results, most points lie on the crosswise line of each diagram, which implies complete coincidence of the measured and reconciled values.
Similar results for the four problematic HDS flow meters are presented in Fig. 5a [184,977 bytes]. These instruments are the flow indicators FIC 34004 (mixed light and heavy gas oil streams entering the HDS unit), FIC 34006 (LCO stream entering the HDS unit), FIC 34055 (desulfurized-diesel component leaving the HDS unit), and FIC 34072 (LCO stream).
As clearly indicated by Fig. 5a, the FIC 34004 flowmeter exhibits a negative bias. The remaining three flowmeters (FIC 34072, FIC 34006, and FIC 34055) have calibration problems because large deviations (negative or positive) from "real" (reconciled) values are indicated.
Variations exist both for high (FIC 34072) and low (FIC 34006 and FIC 34055) flow rates. The characterization of a flow rate as high or low is made on the basis of the ratio of the measured variable value over each instrument's span, not on the absolute value of the stream's flow rate. Thus, conclusions are drawn on a comparable level for all measured values (all values are scaled between 0 and 1).
Reconciled data can be used to calibrate the problematic instruments to eliminate the bias.
As clearly depicted in Fig. 5b, the bias is eliminated, and most of the data points now lie closer to the crosswise line of all diagrams. Points with large deviation from the crosswise line correspond to unsteady operation of the plant for the specific time period for which mean values for the measured variables were initially assumed.
References
- Mah, R.S.H., Chemical Process Structures and Information Flows, Butterworths, New York, 1990.
- Romagnoli, J.A., "On Data Reconciliation: Constraints, Processing and Treatment of Bias," Chemical Engineering Science, Vol. 38, 1983, pp. 1107-17.
- Romagnoli, J.A., and Stephanop oulos, G., "Rectification of Process Measurement Data in the Presence of Gross Errors," Chemical Engineering Science, Vol. 36, 1981, pp. 1849-62.
The Authors

Nikolaos G. Voros is technical consultant for Remaco SA, a Greek consulting firm. His main scientific areas of interest are process analysis and design; simulation and optimization of physical and chemical processes; design of desalination plants, energy-saving systems, systems for renewable energy exploitation; and assessment of industrial investments.Voros holds an MS and a PhD in chemical engineering from the National Technical University of Athens.

Chris T. Kiranoudis is a lecturer at National University of Athens. He is currently involved with projects that concern process control, analysis and design of systems, and computational fluid dynamics, covering conventional chemical industries and specialized food processes as well as energy conservation in power plants.Kiranoudis holds an MS and a PhD in chemical engineering from the National Technical University of Athens.

![Fig. 1 [94,426 bytes]](http://images.pennwellnet.com/ogj/images/ogj2/9701jvo01.gif)
![Fig. 2 [94,153 bytes]](http://images.pennwellnet.com/ogj/images/ogj2/9701jvo02.gif)
![Table 1 [105,664 bytes]](http://images.pennwellnet.com/ogj/images/ogj2/97013601.gif)
![Fig. 3 [87,934 bytes]](http://images.pennwellnet.com/ogj/images/ogj2/9701jvo03.gif)
![Fig. 4 [63,254 bytes]](http://images.pennwellnet.com/ogj/images/ogj2/9701jvo04.gif)
![Fig. 5a [184,977 bytes]](http://images.pennwellnet.com/ogj/images/ogj2/9701jvo05.gif)
Dimitrios Marinos-Kouris is the head of the Department of Chemical Engineering at the National Technical University of Athens. He was previously a senior consultant for the Hellenic Aspropyrgos refinery, Pyrcal SA, and Metba SA. He has also been a member of the technical board of the Commercial Bank of Greece. Marinos-Kouris' scientific interests include economic and design aspects of process plants.He holds a BS and a PhD in chemical engineering from the National Technical University of Athens and an MS from the University of Manchester.
Copyright 1998 Oil & Gas Journal. All Rights Reserved.