Fracture conductivity optimized in China's Longmaxi shale
Ran Zhang
Gensheng Li
China University of Petroleum
Beijing
Zhihong Zhao
Han Zhang
Southwest Petroleum University
Chengdu, China
Fractures induced by hydraulic fracturing combine with natural fractures to create a complex network in China's Longmaxi shale in the Sichuan basin. Shale producers seek to optimize conductivity within a fracturing network, increasing output. The method presented in this article reduced fracturing fluid volumes, cut completion costs, and improved gas production.
This article outlines a fracture conductivity evaluation system (FCES) designed to optimize gas production. The FCES model helps determine the best sand concentration for propped fractures. Uneven shear surface supports self-propped fractures.
The Silurian Longmaxi shale in southern Sichuan basin is 100-600 m thick with total organic carbon of 0.35-18.4%, Type I and II organic matter, and an average brittle minerals content of 65.8%.
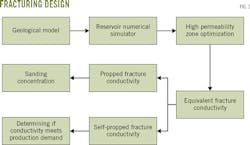
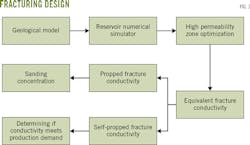
Sinopec Southwest Oil and Gas Branch Co. completed W1-W7 wells using hydraulic fracturing. Fig. 1 shows the basic flow of the fracturing design.
Researchers ran FCES statistical simulations on these wells, concluding optimal conductivity stemmed from multi-stage completions using various proppant concentrations. The simulations sought to determine optimal conductivity in the fracture network, a high-permeability zone (HPZ). Water and electric principles guided researchers' laboratory calculations on underground incompressible fluid flow through a porous medium. A series-parallel circuit was used to calculate underground fluid flow.
Model logistics
The W1 well served as a test for the conductivity-optimization simulations. W1 is 4,788 m deep (3,621.6 m TVD). The lateral length is nearly 1,005 m. Logging data showed reservoir thickness of 27.5 m with permeability of 0.018-0.641 md with 2.48-4.94% porosity.
The W1 well was completed with 42 fracture jobs in 16 stages. Researchers calculated optimal conductivity with shale gas simulations based on a coalbed methane module. The gas simulation model measured 2,000 m wide by 1,000 m long. Thickness was 27.5 m with 5-m grid spacing.
The W1 well conductivity model used the HPZ's volume and permeability to forecast methods for improving gas production. Optimal volume was 30.8 × 10⁴ cu m. Optimal permeability was 3 md.
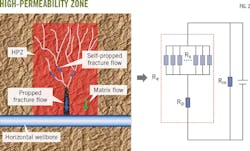
The HPZ contains the unfractured matrix (the shale), propped fractures, and self-propped fractures. Shale gas flows from self-propped fractures to propped fractures, next moving through the matrix to the wellbore
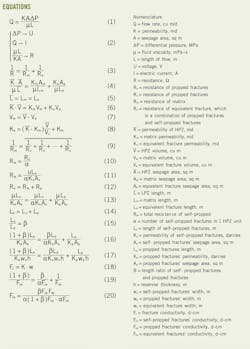
Equation 1 shows how gas seepage confirmed Darcy's law in making a comparison between calculating electric flow and calculating fracturing fluid flow. Equation 2 shows how differential pressure, flow rate, and flow resistance corresponded to voltage, electric current, and resistance.
Fig. 2 demonstrates the HPZ gas flow. The diagram shows the resistance of propped fractures, self-propped fractures, and the matrix. Re represents resistance of equivalent fractures, the sum of propped and self-propped fractures (Rp and Rs).
The resistance types studied are connected in parallel. Equation 3 shows Re connected in parallel with Rm Equation 4 combines Equations 2-3. Equation 5 determines the gas flow. Equation 6 combines Equations 4-5. Equation 7 is a simplified version of Equation 6. Equation 8 determines a curve showing the relationship between volume and permeability of an equivalent fracture.
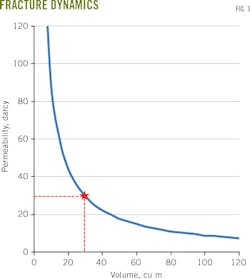
Fig. 3 shows the permeability of equivalent fractures decreasing immediately while volume increased. The curve shows an inflection point. Permeability grows rapidly while volume drops slowly on the left of the inflection point.
Volume grows rapidly with permeability slowly declining on the right side of the inflection point, which marks the optimal equilibrium point of adding proppant and creating fractures. The volume was 29.94 cu m. Permeability was 29.94 darcies.
Propped, self-propped fractures
Equation 9 shows self-propped fractures' total resistance. Equation 9 was rearranged as Equation 10. Equation 11 combines Equation 2 and Equation 10. Equation 12 shows the equivalent fracture resistance. Equations 13-14 provide a sampled version of equivalent fracture resistance.
Equation 15 demonstrates the length ratio of self-propped fractures and propped fractures based on micro seismic monitoring data. Equations 16-17 were derived by combining Equations 13-15.
Equation 18 follows a traditional fracture conductivity definition. It was substituted into Equation 17 and rewritten as Equation 19.
The equivalent fracture conductivity is 11.64 d/cm based on optimal volume and permeability, Equation 20 shows the relationship curve between conductivity of propped fractures and self-propped fractures.
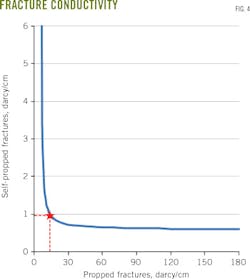
Fig. 4 shows an obvious infection point in the curve. A coordinated value corresponds to a stable inflection point.
Self-propped fracture conductivity grows rapidly as propped fracture conductivity slows to the left of the inflection point. Propped fractures' conductivity increases rapidly while self-propped fractures' conductivity declines slowly to the right of the inflection point.
Optimal conductivity of propped fractures was 14.09 d/cm and self-propped fractures was 0.99 d/cm. Researchers acknowledged the optimal value would be a range for both self-propped and propped fractures in field operations.
The curve in Fig. 4 shows the conductivity of self-popped fractures (0.871 d/cm and 1.23 d/cm) corresponds to that of propped fractures (11 d/cm and 17 d/cm, respectively).
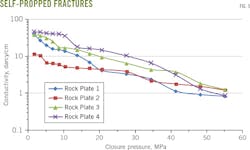
Laboratory simulations for self-propped fractures showed closure pressures of 1.73-55.2 MPa. Researchers used FCES to test the conductivity of four rock plates. Fig. 5 shows 0.87-1.23 d/cm conductivity for self-propped fractures under 55.2 MPa.
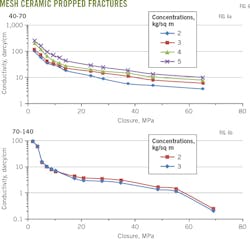
The self-propped fractures' optimal conductivity to meet W1 production demands was 0.99 d/cm. Fig. 6 shows the conductivity tests using 40-70 mesh ceramic proppant with different sanding concentrations.
Fig. 6a shows proppant conductivity growing gradually with increased sand concentration. W1 well's conductivity was 12.69 d/cm when the concentration of 40-70 mesh was 5 kg/sq m. The final results of propped fracture conductivity tests must achieve the range of 11-17 d/cm.
Fig. 6b shows the conductivity results using 70-140 proppant and sanding concentrations of 2 kg/sq m and 3 kg/sq m. Conductivity was more than 1 d/cm when sand concentration was 2-3 kg sq m under 55.2-MPa pressure.
Researchers concluded the optimal W1 sanding concentration was 2 kg/sq m using 70-140 mesh.
Testing determined the multistage completions and proppant concentrations needed to optimize conductivity should be 30-50 mesh ceramic proppants with sand concentrations of 2-2.5% and 40-70 mesh ceramic proppants with sand proportions of 2.5-3% for the main fractures.
For secondary fractures, researchers recommend 70-140 mesh ceramic proppants with sand proportions of 2-3%.
Table 1 shows optimization stimulation results. Table 2 compares the volumes of fracturing fluid and proppant. It also compared W1 and W2 production rates. W1 used the least fracturing fluid volumes and lowest proppant concentrations. W2 had the larger operational scale of the two wells.
Acknowledgment
The authors thank the National Natural Science Foundation of China (51210006, U1562212, and 51525404) for its support.
Bibliography
Guo, J., Gou, B., Yu, T., and Yi, J., "New Design Method of Multi-Stage Hydraulic Fracturing in Shale Horizontal Well," Offshore Technology Conference Asia, Kuala Lumpur, Mar. 25-28, 2014.
Mckenna J.P., "Where Did the Proppant Go?" Unconventional Resources Technology Conference, Denver, Aug. 25-27, 2014.
Zeng, J., Deng, Y., Guo, J., Lu, C., Gou, B., and Zeng, F., "A Mathematical Model for Calculating the Volume of Proppant in Shale Vertical Wells," Society of Petroleum Engineers/ Ikatan Ahli Teknik Perminyakan Indonesia (SPE-IATPI) Asia Pacific Oil & Gas Conference and Exhibition, Nusa Dua, Bali, Oct. 20-22, 2015.
EQUATIONS
The authors
Ran Zhang ([email protected]) is a doctoral student at China University of Petroleum, Beijing. He studies well engineering and reservoir stimulation at the university's State Key Laboratory of Petroleum Resource and Prospecting. He obtained his BS in mechanical manufacturing and automation (2010) from Southwest Petroleum University and his MS in petroleum engineering (2013) from China University of Petroleum.
Gensheng Li ([email protected]) is a petroleum engineering professor at the China University of Petroleum, Beijing. He obtained his PhD in engineering (1998) from China University of Petroleum. Li belongs to the Chinese Academy of Engineering.
Zhihong Zhao ([email protected]) is an associate professor at the School of Petroleum and Gas Engineering, Southwest Petroleum University, Chengdu, China. He obtained his PhD (2011) in petroleum engineering from Southwest Petroleum University.
Han Zhang ([email protected]) works for Sinopec Chongqing Fuling Shale Gas Exploration and Development Co. Ltd. He earned an MS (2017) in reservoir stimulation theory and technology at Southwest Petroleum University's State Key Laboratory of Oil and Gas Reservoir Geology and Exploitation. He obtained his BS (2014) in mechanical manufacturing and automation from Southwest Petroleum University.
