Operators use reservoir metrics to select bid prospects
Rafael Sandrea
ICP Petroleum Consultants Inc.
Houston
Ivan Sandrea
Oxford Institute for Energy Studies
Oxford, UK
Complex data packages associated with bid appraisals require operators' time and careful attention. Financial stakes are high, yet bid organizers typically limit the time allowed for preparation work to a few weeks.
Wood Mackenzie Ltd. said global exploration spending reached $95 billion in 2014.1 Development costs are roughly three times exploration costs. Petrobras estimates finding and development (F&D) costs of $50-100 billion for Lula field, a pre-salt discovery with estimated reserves of 8 billion bbl.
The US Energy Information Administration (EIA) estimated F&D costs in the deepwater Gulf of Mexico at $12-25/bbl.2
Countries worldwide awarded more than 100 exploration and development licenses during 2015. A single licensing round can involve 12 or more prospects. Operators need a strategy to rank prospects and guide production-investment decisions during bid preparation.
Operators stand to benefit from deciding on top prospects at an early stage. A prospective bidder starts with initial geophysical and geological evaluations, basic reservoir parameters, and the potential reserves of each prospect. Operators need a ranking system to identify top prospects worthy of investment analysis.
The Upstream Financial Opportunity Index (UFO) presented here is one such system, related to a reservoir-quality index that forecasts field well-productivity worldwide (OGJ, Dec. 5, 2016, p. 55).
UFO model
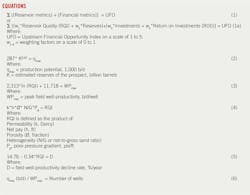
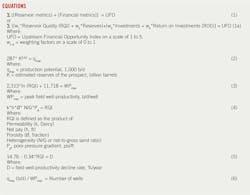
The UFO uses two fundamental metric types-reservoir and financial-to rank the best prospects or blocks on which to make bids (Equation 1).
The UFO is a non-dimensional grading system with a range of 1 to 5, 5 representing prospects having the highest reservoir-quality, largest potential reserves, lowest finding and development (F&D) costs, and highest profitability.
Reservoir metrics combine reservoir quality (RQI) and quantity. RQI collates five static parameters-permeability, porosity, net pay, pore-pressure gradient, and heterogeneity-into a single number. Ghawar field has an RQI of 9.
The quantitative reservoir component refers to a prospect's most likely recoverable resources (potential reserves). Evaluators typically apply Monte Carlo or decision tree analysis to the standard volumetric equation to estimate quantitative reservoir characteristics.
Financial metrics involve two components: full-cost F&D and the corresponding return on investment (ROI).
Other metrics include net present value (NPV), internal rate of return (IRR), payback, and average cash flow (CF/b). Some are more attractive for the short-term investor while others address 25-year or greater investment scenarios with multiple cash inflows and outflows. Long-term scenarios characterize the exploration-development case.
Resource-development models usually generate these metrics. The American Council for Capital Formation reports an average ROI of 11.7% for integrated petroleum companies and 12.8% for independent producers during 2011-14.3
Table 1 defines reservoir and financial metrics as well as the five-tier UFO grading system. Linear interpolation provides intermediate grade values. If a prospect's potential reserves are 100 million bbl, its grade would be 1.52 while 400 million bbl of reserves would have a grade of 4.13.
These limits generally refer to the top and bottom quartiles of publicly available industry statistics and those provided by EIA's Financial Reporting System Form 28 (EIA-28).
EIA-28 collects data used to analyze the industry's competitiveness as well as its resource development, supply distribution, and profitability issues.
The RQI, developed in 2016, helps operators evaluate giant fields worldwide. Its lower limit of potential reserves reflects the range of discoveries within a decade. The upper limit involves giant oil and gas fields, which have more than 500 million boe in estimated reserves.
The authors also established limits for F&D costs and anticipated ROI for upstream projects worldwide. EIA data from 1998-2000 show high and low F&D limits of $7.43/bbl and $4.37/bbl. Operators can customize F&D limits to fit their own scenarios.
The same holds true for the optional weighting factors on a 0-1 scale shown in Equation 1. This article assumes a value of 1 for all weighting factors to establish comparative consistency.
Evaluators use reservoir metrics only in the first stage of rankings, paring down multiple prospects to the top three that advance to the next stage of investment analysis.
Operators typically find a large gap in field information that must be resolved between completing reservoir analysis and starting a full-development investment analysis. Investment analysis cannot proceed without a dependable production forecast.
Evaluators and senior executives forecast the number of wells when selecting development prospects. Drilling expenditures are the major expense. Cash inflow and cash outflow forecasts are the weakest links in exploration economic models because they depend on best-judgment predictions that are short on engineering input.
The use of nearby field analogs is not applicable in frontier exploration where wells can be hundreds of miles apart.
Operators need reliable estimates of vital field parameters such as production potential, peak well-productivity, and decline rate. This study improves current forecast methodology by using well-established worldwide field-based algorithms to determine critical production metrics. (OGJ, Dec. 5, 2016, p. 55, and OGJ, May 22, 2006, p. 30).
Equation 2 shows how production forecasting was done while Equation 3 shows how peak field well-productivity was calculated.
Equation 4 defines RQI as the product of permeability (k, Darcy), net pay (h, ft), porosity (Ø, fraction), heterogeneity (N/G or net-to-gross sand ratio), and pore-pressure gradient (Pg, psi/ft).
This article uses a value of 1 for reservoirs having an average permeability greater than 1 darcy. The decline rate is shown in Equation 5 where D is the field well-productivity (WP) decline rate in %/year.
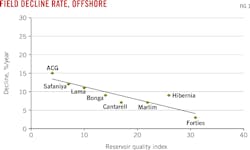
Fig. 1 shows the relationship of the field well-productivity decline rate with the RQI. It involves a correlation coefficient (r2) of 0.80. Equation 6 accounts for the number of producing wells needed to justify a project's estimated cost.
Completing the investment analysis phase allows determination of pertinent grades for the financial metrics. The combined UFO reserves (UFOR) and UFO financials (UFOF) grades give a total UFO-ranking for prospects. The top three reflect the best bidding prospects.
But investment analysis continues beyond this point. Typical exploration bids require two binding commitments by the bidder: a minimum number of exploratory wells to be drilled and a royalty rate on future production. The licensor uses a points system applied to these two numbers, relative to baseline values specified in the bid terms, finally determines the winning bid.
Issues outside standard economic models influence UFO results. Such issues include country risk, national content requirements, and upfront signing bonuses.
Ranking process
Table 2 shows a case example consisting of 10 hypothetical prospects. The table summarizes reservoir-ranking results, including estimates of field production parameters using algorithms already discussed.
The grades are obtained by linear interpolation of the limits established in Table 1. This is a standard system industry uses for establishing indexes covering political, fiscal, and environmental risks.
The authors' model is applicable for investment analysis, including exploration prospects, revitalizing mature fields, and enhanced oil recovery prospects.
In-depth analysis of the top three prospects establishes F&D and ROI values for each. Table 2 shows estimated field parameters to be used in the financial phase. The UFOF ranking process is similar to that for determining UFOR.
Evaluators derive a final UFO ranking by combining the UFOR and UFOF grades and dividing the sum by 4.
This article skipped this step because it was impractical to generate generic financial values for hypothetical prospects. In real analyses, UFO rankings entail estimating economic parameters such as oil prices, operating expenses, royalty rates, taxes, and several other factors that vary for each prospect.
References
1. Wood Mackenzie Ltd., "Impact of Exploration on Global Oil Supply," April 2016.
2. Energy Information Administration, "Trends in US Oil and Natural Gas Upstream Costs," Mar. 23, 2016.
3. Thorning, M., "Oil Industry Profitability and Tax Policy," American Council for Capital Formation Center report published by Bloomberg, Oct. 25, 2016.
The authors
Rafael Sandrea (sandrear@ipc66) is president of IPC Petroleum Consultants Inc., Houston. He administers webinars and classes online and speaks worldwide on reserves, IOR-EOR, shale oil and gas assessment, and global oil and gas supply. He holds a PhD (1966) in petroleum engineering from Penn State University.
Ivan Sandrea ([email protected]) is the founder and chief executive officer of Sierra Oil and Gas in Mexico City. He is a member of the Oxford Institute for Energy Studies, the Global Business Policy Council of AT Kearney, and the Energy Policy Research Foundation in Washington DC. Sandrea has more than 20 years of oil and gas experience. Previously, Sandrea was co-head of the global oil and gas emerging markets practice for Ernst & Young LLP and president of Energy Intelligence Group. He has worked for Statoil, BP PLC, and was head of oil supply for the Organization of Petroleum Exporting Countries (OPEC). He represented OPEC in the United Nations reserve reclassification work. Sandrea has a BS in geology from Baylor University, and an MS and MBA from Edinburgh University. He attended the Berkeley Executive Leadership Program in Stanford.


