Data analytics collates well completions, improves performance parameters
Abhishek Gaurav
Texas Standard Oil LLC
Houston
Multivariate analysis of existing well performance data can outperform the trial-and-error completion-design programs common to many unconventional reservoirs. A recent asset evaluation in the Permian basin-a multiple bench play with different landing depths-proved that shorter frac stages in horizontal wells addressed problems associated with heterogeneity along wellbore lengths.
Lateral placement and completions design are key in targeting shale assets. Completion technology advances rapidly and this can be problematic as formations often require a tailored completion design as opposed to application of a uniform system across an entire field. While factory approaches are common in many shale plays, they are not always the best solution.
Application variables
Horizontal drilling is a standard operation and acts that improve well performance include:
• Staying in the pay zone.
• Avoiding severe dog-legs in the lateral wellbore.
• Landing the well relative to formation top (an indication of which bench is targeted in a multiformation play).
Some of the common geological variables that affect well performance related to hydraulic fracturing are:
• Reservoir pressure gradient.
• Intermix of lithologies (shale mixed with carbonate or quartz).
• Reservoir depth.
• Sweet-spot thickness.
• Presence-absence of fracture barriers.
Permian operators have experienced better sustained production with pumping more proppant, but other variables are equally influential on well performance, including fluid type (gel, x-linked gel, or slickwater), horizontal stages and stage lengths, clusters per stage, wellbore length, and acid jobs (depending on carbonate richness).
Data mining, evaluation
Asset-evaluation teams maintain both an awareness of the different technologies at play and an in-depth understanding of the science behind them. Data analytics and improved visualization techniques provide an additional tool to assist in decision making. Evaluation becomes more difficult in multibench shale plays where multiple formations are targeted with constantly evolving completion techniques.
This article outlines an asset evaluation for an area in the Permian basin-including Midland and Delaware basins-that used data mining to determine the highest performing completion designs for formations in the region.
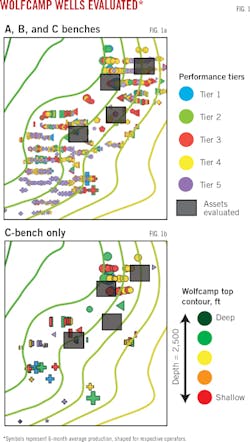
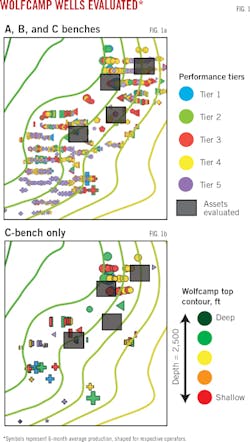
The acreage evaluated appears in semitransparent black rectangles (Fig. 1a). The contour lines represent the top of Wolfcamp's geological structure. The individual dots represent producing horizontal wells and their sizes signify 6-month cumulative production. Performance tiers are arranged by color with Tier 1 being the richest 20% and Tier 5 the poorest. The Wolfcamp is present in as many as four area benches. Wells from each require grouping to evaluate separately. Fig. 1b features only Bench-C wells.
The multivariate plot indicates performance tiers with the blue line representing the highest-producing wells (Tier 1) and purple the poorest-performing (Tier 5) (Fig. 2).
This article analyzed median variables such as 6-month cumulative production (boe, normalized to a 2-mile lateral), proppant loading (lb/ft), depth below the Wolfcamp top (ft), fluid loading (lb/gal), fracture stage and lateral wellbore length, and acid loading (gal/ft). For fluid loading, slickwater fracture jobs typically have small values (< 1) and x-link gels have higher values (> 1). The multivariate analysis also observed the depth of the Wolfcamp top (ft), but this information was removed from Fig. 2 to maintain confidentiality.
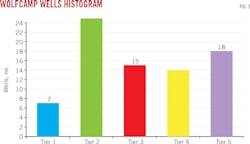
A histogram for wells in each tier provides the range of drilling activity, with only 7 wells in the highest performing tier. Tier 2 had the most wells, 25. Tiers 3-5 had 15, 18, and 14 wells, respectively.
Analysis identified a relationship between performance and completion variables (Fig. 2). The blue and purple lines (Tiers 1 and 5) maintained relative depths for the top of Wolfcamp and landing the lateral. Tier 1 wells were completed with nearly 1,400 lb/ft of proppant, fractured in 121-ft stages with < 1 lb/gal of fluid (indicating slickwater) and a moderate amount of acid. Tier 1 wells were shorter than those in Tier 5 (< 6,000 ft compared with 8,000 ft).
The poorer performing Tier 5 wells were completed with only 700 lb/ft of proppant, longer 240-ft fracture stages, < 1 lb/gal slickwater, and a higher amount of acid.
Six-month cumulative production for Tier 1 wells was 130,000 boe with Tier 5 wells producing only 36,000 boe in the first 6 months.
Estimated ultimate recovery (EUR) for Wolfcamp horizontal wells is 8-11 times 6-month cumulative production. EUR equals 1.3 million boe/Tier 1 well with a 10× multiplier. Tier 5 wells yield 400,000 boe with the same formula. Tier 3 wells were completed with variables ranging between Tiers 1 and 5 and a 6-month cumulative production of 80,000 boe. Extrapolating the same formula indicates EUR of 800,000 boe for Tier 3 wells.
Wolfcamp bench C
The completion variables most important to Wolfcamp Bench-C wells are proppant loading and stage length. Data were limited for frac clusters and holes per cluster, which prevented analysis from identifying different strategies for wells with shorter stages compared to those with longer stages. Despite the lack of data, literature on this subject suggests that fracturing similar rocks together improves cluster efficiency. Shorter frac stages can improve performance in heterogeneous formations.
Benches A and B were analyzed in the same multivariable setting. This part of the Permian basin appeared to be uneconomic in the current price environment, but data analytics showed its ability to perform profitably instead.
The author
Abhishek Gaurav ([email protected]) is a petroleum engineer at Texas Standard Oil LLC, Bellaire, Tex. He has also served as a completions optimization engineer at Microseismic Inc. and a reservoir geoscientist at CGG. He holds a master's degree in petroleum engineering from the University of Texas at Austin and a bachelor's degree from the Indian Institute of Technology, Madras. He is a member of the Society of Petroleum Engineers.


