Raw seismic velocities aid predictions in mud program designs
Khalid Amin Khan
Oil and Gas Development Co. Ltd.
Islamabad, Pakistan
Anees Ahmad Bangash
Gulraiz Akhter
Quaid-i-Azam University
Islamabad, Pakistan
Geologically realistic models generated from raw seismic velocities can predict pore pressure and fracture gradients useful in designing safe, economic predrill mud programs. This article presents an efficient workflow to depict pressure regimes in prospective drillsites generated in the form of 2D cross-sections or 3D cubes. Care must be taken when devising these models as the reliability of subsurface pressure estimates depends on the velocity-model input.
In offshore and frontier areas, predrill estimation of formation pore pressures from seismic data is becoming standard exploration and production practice. Knowing the pore pressure ahead of the drillbit can improve well control through tailored mud programs and casing designs. This process also lowers cost without compromising safety or the environment.
Historical prediction methods
Raw root-mean-square (RMS) velocities can be processed to generate a geologically realistic velocity model. Geophysicists can then use this model to estimate effective stress, overburden stress, pore pressure, and fracture gradients. This article presents the workflow's successful application to seismic velocities along a 2D seismic line and displays how the model can be equally useful generating pore pressure and fracture gradient cubes in 3D seismic.
Pore pressure is the acting pressure on fluids in the pore space of a formation. Estimates of subsurface pressure regimes are important for minimizing risk and uncertainty associated with drilling, and pore pressure information is useful in all exploration and development phases.
During exploration, pore pressure data can increase understanding of basin geometry, trap integrity, hydrocarbon migration pathways, and the distribution of pressure with respect to structure and identification of sealing and leaking faults.1 Pore pressure data minimize drilling risk by applying appropriate mud weight and optimizing casing design to keep the well under control.
Engineers historically predicted pore pressure using logs from nearby wells. In recent years seismic velocities allow generation of 2D pore pressure sections and 3D pore pressure volumes, but each technique has its limitations.
Pore pressure estimates from well logs are spatially limited, but are accurate for a depth range at the well point. Seismic data have good spatial coverage from top to bottom, but pore pressure predictions are dependent on the accuracy of seismic velocities. Advancements in seismic data processing have provided more accurate velocities in recent years, resulting in more reliable pore pressure estimates. Previous studies have attempted to predict pore pressure from resistivity and sonic logs, and others have discussed estimation of fracture gradients from logs (OGJ, Feb. 13, 1967, p. 92).2-9
Studies also discussed pore pressure estimates derived from seismic which show the importance of accurate velocity models in determining pore pressure.10-15 A variety of velocity techniques are useful in predicting pore pressure.1 16
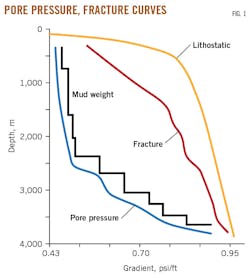
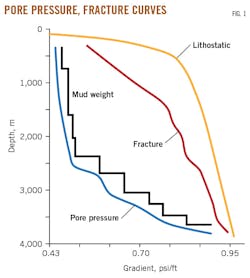
In mud designs, pore pressure gradient defines the minimum weight limits while fracture gradient defines the upper weight limits (Fig. 1). Formation fluids exert pressure on the borehole wall. To avoid fluid influx and wellbore collapse, mud weight should always be higher than pore pressure. In contrast, if the mud weight is higher than the formation fracture gradient the wellbore will fracture, releasing mud into the formation.
Prediction method
The simple workflow presented in this article predicts pore pressure and fracture gradient using seismic-derived velocities.5 14
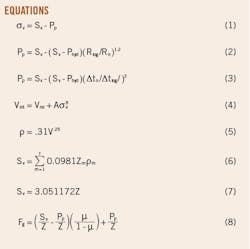
Pore pressure prediction links pore pressure (Pp), overburden pressure (Sv), and vertical effective stress (σv) (Equation 1).18 Overburden pressure at any depth is a product of the combined weight of the rock matrix and pore fluids overlying the formation. Vertical effective stress is the pressure acting on the solid-rock framework. Effective stress controls the compaction in rocks and reducing it results in overpressure.19-20
Equations 2 and 3 represent relationships for pore pressure prediction using resistivity and sonic logs.4 Where Phyd is hydrostatic pressure and Δtlog and Rlog are sonic transit time and resistivity from logs, respectively. Transit time (Δtn) and resistivity values (Rn) form the normal compaction trends.
The exponents in Equations 2 and 3 can be changed to better match pore pressure predictions from different regions, but the selection of the correct normal compaction trend line can be problematic.13
Equation 4 presents an empirical relationship between seismic interval velocity (Vint) and vertical effective stress. Vml is velocity at mudline, usually 5,000 ft/sec. The calibration parameters are adjusted as A=19.8 and B=0.62. Equation 4 can effectively predict pore pressure by transforming velocity to effective stress.
The workflow's calculations also derive overburden pressure from the velocity data. Equation 5 transforms density to velocity and computes densities (ρ) for each interval.20
With the derived densities, Equation 6 computes overburden pressure where Zm and ρm are thicknesses and densities of each formation interval and f is the number of formations.
Equation 7 provides the general overburden pressure trend with depth (Z).21 Pore pressure is calculated as the difference between overburden pressure and vertical effective stress. Equation 8 computes the fracture gradient (Fg) where Sv/Z is overburden gradient, Pp/Z is pore pressure gradient, and µ is Poisson's ratio computed from compressional velocity and derived shear velocity.23
Accurate velocity is the most critical parameter for reliable pore pressure prediction. Many velocity determination techniques are available in seismic data processing, including:1
• Automated velocity analysis.
• Dense velocity analysis.
• Geologically consistent velocity analysis.
• Horizon-based velocity analysis.
• Residual velocity analysis.
• Reflection tomography.
• Seismic inversion.
Velocity-to-pore pressure
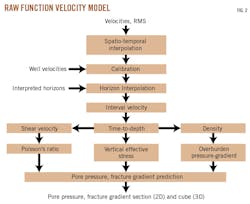
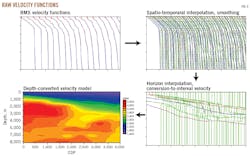
An organization chart of the workflow presented is demonstrated on a velocity dataset along a 2D seismic line to show the output of each stage (Fig. 2). RMS velocities are obtained from seismic data in the form of velocity functions. Each function consists of velocity-time pairs picked at prominent reflectors during velocity analysis. These picks do not represent the true geologic intervals as velocity analysis is performed by stacking the data without migration. For pore pressure prediction, therefore, these raw velocities need to be refined into a geologically realistic velocity model (OGJ, Dec. 5, 2011, p. 52).
This method applies spatio-temporal interpolation to the input velocities with spatial intervals of 1-10 common-depth points (CDP) and temporal intervals of 50-200 ms, resulting in an equally spaced velocity grid (Fig. 3).
A moving-average operator smooths the velocity trend and filters out any sharp kinks caused by potential mispicks during velocity analysis. If a well control reading is available, these velocities can be calibrated using the well velocities. Geophysicists use interpreted horizons to interpolate the velocities at each horizon, placing the velocity-time pairs in a velocity function at true geologic intervals. These functions can then be converted into interval velocities.25
The interval velocities undergo a time-to-depth conversion to generate a velocity model that closely follows the depth section generated from interpreted horizons and faults. The velocity model consists of closely spaced velocity-depth pairs. A visual output-input language (OIL) program transforms velocity models into pore pressure and fracture gradient sections or cubes.24-26 The resulting velocity field is then converted into vertical effective stress.13
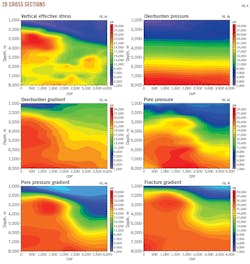
Fig. 4a shows a 2D cross-section of vertical and lateral variations in vertical effective stress. The velocity data are also transformed into density.20 The workflow can use density data to compute overburden pressure and subsequently overburden gradient (Figs. 4b-4c). Computations with vertical effective stress and overburden pressure can generate pore pressure and pore pressure gradient cross-sections (Figs. 4d-4e). In the final steps, the workflow transforms velocity data into shear velocity and Poisson's ratio to generate a fracture gradient cross section (Fig. 4f).
Evidence shows that pore pressure gradient is always lower than the fracture gradient, and together these two gradients define the window for designing the mud program.
The pore pressure and fracture gradient curves at the proposed drill location can be generated from their respective cross-sections. For the example in this article, the input velocity data represent a 2D cross-section. The presented workflow is equally useful in processing 3D velocity data to generate cubes of vertical effective stress, overburden pressure, overburden gradient, pore pressure, and fracture gradient.
References
1. Chopra, S., and Huffman, A.R., "Velocity determination for pore pressure prediction," Canadian Society of Exploration Geophysicists (CSEG) Recorder, April 2006, pp. 28-46.
2. Hottman, C.E., and Johnson, R.K., "Estimation of formation pressures from log derived shale properties," Journal of Petroleum Technology (JPT), Vol. 17, No. 6, June 1965, pp. 717-722.
3. Eaton, B.A., "Graphical method predicts geopressure worldwide," World Oil, Vol.182, June 1972, pp. 51-56.
4. Eaton, B.A., "The equation for geopressure prediction from well logs," Society of Petroleum Engineers (SPE) Annual Technical Conference and Exhibition, SPE No. 5544-NS, Dallas, Tex., Sept. 28-Oct. 1, 1975.
5. Eaton B.A., "Fracture Gradient Prediction and its Application in Oil Field Operations," JPT, Vol. 21, No. 10, October 1969, pp.1353-1360.
6. Anderson, R.A., Ingram, D.S., and Zanier, A.M., "Determining Fracture Pressure Gradients from Well Logs," JPT, Vol. 25, No. 11, November 1973, pp. 1259-1268.
7. Daines, S.R., "Prediction of Fracture Pressure for Wildcat Wells," JPT, Vol. 34, No. 4, April 1982, pp. 863-872.
8. Traugott, M.O., "Pore Pressure and Fracture Pressure Determinations in Deepwater," Deepwater Technology Supplement to World Oil, August 1997, pp. 68-70.
9. Barker, J.W., and Meeks,W.R., "Estimating Fracture Gradient in Gulf of Mexico Deepwater, Shallow, Massive Salt Sections," Paper SPE-84552, SPE Annual Technical Conference and Exhibition, Denver, Colorado, Oct. 5-8, 2003.
10. Pennebaker, E.S. "Seismic data indicate depth and magnitude of abnormal pressure," World Oil, Vol. 166, June 1968, pp. 73-82.
11. Reynolds, E.B., "Predicting overpressured zones with seismic data," World Oil, Vol. 171, October 1970, pp. 78-82.
12. Reynolds, E.B., "The application of seismic techniques to drilling techniques," Paper SPE-84552, SPE Annual Technical Conference and Exhibition, Las Vegas, Nev., Sept. 30-Oct. 3, 1973.
13. Bowers, G.L., "Pore pressure estimation from velocity data accounting for overpressure mechanisms besides undercompaction," SPE Drilling and Completion, Vol. 10, No. 2, June 1995, pp. 89-95.
14. Huffman, A.R., "The future of pore pressure prediction using geophysical methods," AAPG Memoir 76, 2002, pp. 217-233.
15. Helset, H.M., Lthje, M., Ojala, I., Lothe, A., Jordan, M., Berg, K., and Nilssen, I.R., "Improved pore pressure prediction from seismic data," European Association of Geoscientists and Engineers Annual International Conference and Exhibition, Barcelona, Spain, June 14-17, 2010.
16. Chopra, S., "Velocity determination for pore-pressure prediction," The Leading Edge, Vol. 25, No. 12, December 2006, pp. 1502-1515.
17. Terzaghi, K., "Theoretical soil mechanics," John Wiley and Sons Inc., 1943.
18. Tosaya, C.A., "Acoustical properties of clay-bearing rocks," PhD Dissertation, Stanford University Department of Geophysics, June 1982.
19. Dvorkin, J., Moos, D., Packwood, J.L. and Nur, A.M., "Identifying patchy saturation from well logs," Geophysics, Vol. 64, No. 6, November 1999, pp. 1756-1759.
20. Gardner, G.H.F., Gardner, L.W., and Gregory, A.R., "Formation velocity and density - the diagnostic basics for stratigraphic traps," Geophysics, Vol. 39, No. 6, December 1974, pp. 770-780.
21. Zoback, M.D., "Reservoir Geomechanics," Cambridge University Press, 2007.
22. Castagna, J.P., Batzle, M.L., and Eastwood, R.L., "Relationships between compressional-wave and shear-wave velocities in clastic silicate rocks," Geophysics, Vol. 50, No. 4, April 1985, pp. 571-581.
23. Dix C.H., "Seismic Velocities for Surface Measurements," Geophysics, Vol. 20, No. 1, January 1955, pp. 68-86.
24. Khan, K.A., Saqib, H.M.J., and Bangash, A.A., "Vel2Pore - A Visual OIL program for computing Overburden Pressure, Vertical Effective Stress and Pore Pressure from Seismic Velocities," Geophysical Research Journal, Vol. 2, 2016, pp. 1-6.
25. Khan, K.A., Akhter, G., and Ahmad, Z., "OIL - Output Input Language for Data Connectivity between Geoscientific Software Applications," Computers & Geosciences, Vol. 36, No. 5, May 2010, pp. 687-697.
26. Khan, K.A., and Akhter, G., "Visual OIL - A Windows-based Front-end Interface for Output Input Language," Geophysical Research Journal, Vol. 1, 2015, pp. 33-40.
The authors
Khalid Amin Khan ([email protected]) is the exploration manager at the Oil & Gas Development Co. Ltd., Pakistan. Previously he served aschief instructor at the Oil & Gas Training Institute. He earned his BS in physics and mathematics and an MS and PhD in geophysics from Quaid-i-Azam University. He is a fellow of the Royal Astronomical Society and a member of the Society of Exploration Geophysicists, American Geophysical Union, International Association of Mathematical Geosciences, and the Pakistan Geophysical Network (PGN).
Anees Ahmad Bangash ([email protected]) is an assistant professor at Quaid-i-Azam University, Islamabad. He earned his BS in physics and mathematics and an MS in geophysics from Quaid-i-Azam University. He is also a student coordinator for PGN.
M. Gulraiz Akhter ([email protected]) is a professor at Quaid-i-Azam University. During his 28 years of experience, he has taught mathematics, geophysics techniques, and hydrogeology. His work experience includes teaching, research, and administration. He holds an MS in geophysics and a PhD in hydrogeology from Quaid-i-Azam University.
